
A Rise, Not a Peak
Ongoing research. This is an experimental result from active work, not a settled conclusion. The numbers are what we measured and the method is described so you can judge it, but the programme is still running and later experiments may revise what it means.
A note on the language in these records. This is a working laboratory notebook for research into training AI models more cheaply and efficiently, so you will read that an approach did not work, that a result did not hold up, or that one method was worse than another. That is the research doing its job, not a verdict on the engineering we deliver to clients. Ruling an approach out is how the search narrows, and these are the pages that teach us the most: nearly every technique we now rely on came from understanding why something else fell short. Testing our own ideas at least as hard as anyone else's is the point of publishing them. More about this programme and why we run it.
Part of a bigger question: How much model does a task need, and what changes when it has more? – The abrupt jump is what spare capacity buys -- it fades smoothly as the model shrinks, long before the model stops working. Capacity and task difficulty act separately, not as a ratio.
In plain English
What we asked. Last time, one public language model showed a pattern in its internal state: a high point just after it learned to copy. One example is not enough, so we checked five copies of the same model trained separately from different random starts.
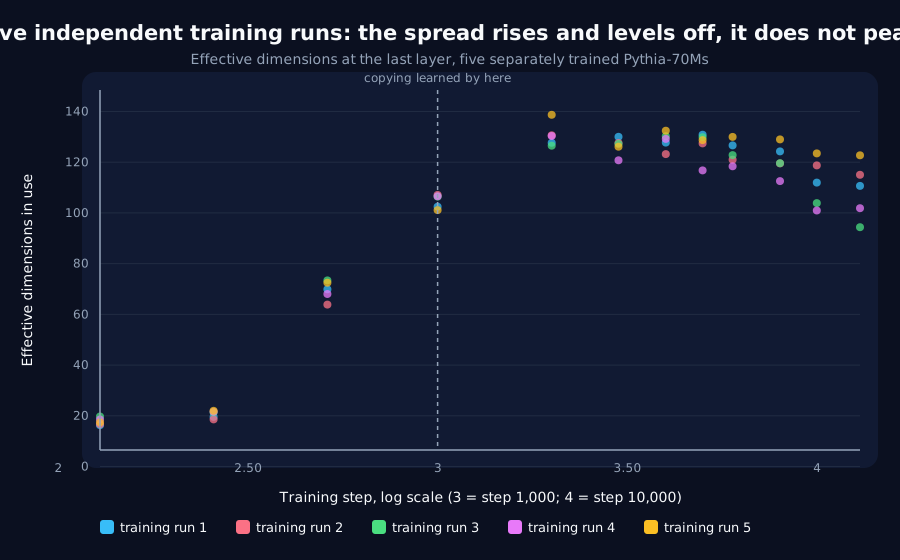
What we found. All five reorganise their internal state as they learn the skill, and then level off. But only three of the five have their single highest point where we predicted, because the top of the curve is flat and its highest point is a matter of luck.
Why it matters. The lesson: when a curve rises and flattens, its highest point says little. Ask when it rose, not where it peaked.
The rest of this page is the technical record: the design, every number, and the limits. It is written for a reviewer, and you do not need it to have understood the result above.
New here? How to read a research record
- Start at the verdict. Every record states, before the experiment was run, what result would have made us abandon the idea. That is the "kill test". Then it says whether the test fired. Nothing gets reinterpreted after the fact.
- Numbers in square brackets are uncertainty.
23.4 [18.1, 28.7]means our best estimate is 23.4 and the true value is probably somewhere in that range. If a range includes zero, we cannot claim an effect. - Results that rule an idea out are kept. Roughly half of what is published here says an approach did not work, including plenty of our own. Those pages are the output, not a shortfall: knowing which direction is a dead end is what lets the next experiment go somewhere better, and most of what we now rely on came out of understanding why something else fell short. Work that only publishes what worked is not measuring anything.
- Read the Limits section. Every record ends with what it does not show. It is the most honest part of any experiment and usually the shortest.
- Pro tip: the figures near the top are designed to carry the result on their own. If you read nothing else, read the caption under each one, which says what it shows and what to take from it.
EXPLORATORY. Not a preregistered study. No training:60published checkpoints of five independently trained Pythia-70M models, measured on a laptop CPU and deleted (about10GB streamed). The design and kill test were committed (6c2a5e7) before any checkpoint was downloaded.
Program v2 Bucket O, item O25. Decisive computation: analysis/pythia_seeds_spread.pyanalysis/pythia_seeds_spread.jsonanalysis/pythia_seeds_plateau.pyanalysis/pythia_seeds_plateau.json
The question
O1 found, after the fact and on one model per size, that the spread of Pythia's final-layer representations (effective dimension) collapses early, then peaks one to two checkpoints after the model learns to copy. O25 tests that on PolyPythias: pythia-70m-seed1 to seed5, five runs with different initialisations and data orders, using O1's probes and measurement code unchanged, at checkpoints 128 to 13000.
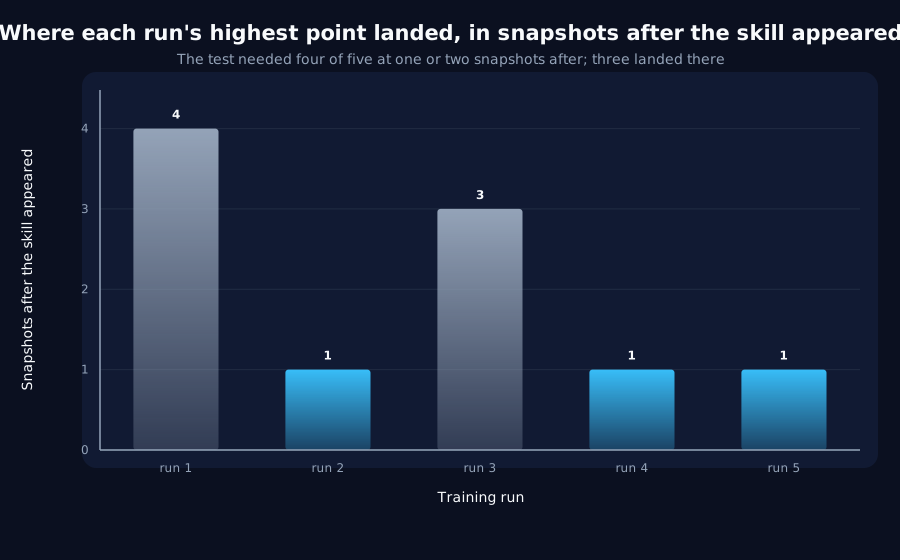
Kill test, fixed before execution: on fewer than four of five seeds does the post-collapse maximum fall one or two checkpoints after induction is acquired. Placed at random, each seed's peak lands there with probability 0.20, so four of five by chance has probability 0.0067. Precondition: induction peaks at 0.5 or more on at least four seeds. It passes (five of five, peaks 0.695-0.834).
Result: the kill test fires
| Seed | Induction acquired | Spread peak | Offset (checkpoints) |
|---|---|---|---|
| 1 | 1000 | 5000 | 4 |
| 2 | 1000 | 2000 | 1 |
| 3 | 1000 | 4000 | 3 |
| 4 | 1000 | 2000 | 1 |
| 5 | 1000 | 2000 | 1 |
Three of five. Every seed learns to copy between steps 512 and 1000, as O1's two models did, so the independent seeds reproduce O1's timing; they do not reproduce a peak.
What the curves actually do
| Seed | Step 512 | Step 2000 | Share of its maximum over 1000-10000 |
|---|---|---|---|
| 1 | 69.9 | 127.6 | 0.976 |
| 2 | 63.9 | 130.6 | 1.000 |
| 3 | 73.4 | 126.5 | 0.971 |
| 4 | 68.0 | 130.3 | 1.000 |
| 5 | 72.5 | 138.7 | 1.000 |
On every seed the spread nearly doubles across the transition and has reached at least 97% of its highest value by step 2000, one checkpoint after the skill appears. It then drifts down slowly (to 101-124 by step 10000). The curve is a rise to a plateau, and which checkpoint on a flat top happens to be highest is decided by noise: seeds 1 and 3 put it at steps 5000 and 4000 by margins of 2.4% and 2.9%. O1's "peak one to two checkpoints after" was the first point of that plateau, read on one seed.
What stands
- Kill test fires: no reproducible peak. A peak one to two checkpoints after the transition appears on three of five independent seeds.
- What does reproduce, on all five: the spread rises sharply over the same archive interval in which copying appears, and levels off by the next checkpoint. That is a rise coincident with the transition, which is what this programme's recurrent models showed as well (v1's "coincident, not leading"), not a peak.
- The O1 thread's method lesson: a maximum is a poor summary of a curve with a flat top. It was twice the wrong statistic here -- at initialisation in O1, on the plateau in O25.
Limits
- One size (70M), five seeds, one probe. The archive's steps
512and1000still bracket everything. - The rise's timing relative to copying cannot be resolved finer than one archive interval; O26 (dense checkpoints, GPU, the maintainer's decision) remains the way to do that.
Terms on this page
Every piece of vocabulary this record uses, in plain language. Generated from the text above, so it cannot drift out of step with it.
- checkpoint
- A saved copy of a model partway through training, so you can come back and inspect what it looked like at that moment.
- effective dimension
- Roughly, how many independent directions a model's internal state actually uses. High means spread out; low means squeezed onto a few.
- induction
- A model's ability to spot that a sequence is repeating and copy what came next last time. A standard early skill in language models.
- kill test
- A condition written down before running the experiment that says what result would make us abandon the idea. Fixing it in advance is what stops a disappointing result being reinterpreted as an encouraging one.
- plateau
- A stretch of training where the model is not visibly improving. Often, though not always, followed by a sudden jump.
- post hoc
- Worked out after the fact, rather than decided in advance. We report such checks separately and never let them decide a result, because it is far too easy to find a pattern once you already know the answer.
- probe
- A small separate model trained to read information out of a bigger model's internals, used as a measuring instrument rather than as a product.
- recurrent
- A design that reads a sequence one item at a time, carrying memory forward. The main alternative is attention, which looks at everything at once.
- reproducible
- Someone else running the same code on the same inputs gets the same numbers. Every result here is checked this way.
- seed
- The number that fixes all the randomness in a training run. Same seed, same run. Running several seeds is how you tell a real effect from a lucky one.
Get new results as we publish them
Roughly monthly, one finding per email, in plain English first. Including the approaches that turned out not to work, which are usually the useful ones. No sales email.
Double opt-in: we send a confirmation link and add nobody who does not click it. One-click unsubscribe on every email.