
Not The Hardest
Ongoing research. This is an experimental result from active work, not a settled conclusion. The numbers are what we measured and the method is described so you can judge it, but the programme is still running and later experiments may revise what it means.
A note on the language in these records. This is a working laboratory notebook for research into training AI models more cheaply and efficiently, so you will read that an approach did not work, that a result did not hold up, or that one method was worse than another. That is the research doing its job, not a verdict on the engineering we deliver to clients. Ruling an approach out is how the search narrows, and these are the pages that teach us the most: nearly every technique we now rely on came from understanding why something else fell short. Testing our own ideas at least as hard as anyone else's is the point of publishing them. More about this programme and why we run it.
Part of a bigger question: Which parts of a model actually matter? – The parts that move most are not the parts that matter, and no single component is required -- the model routes around every freeze. What a part is worth shows up only when you remove it.
In plain English
What we asked. Somebody who can do calculus can also do arithmetic. So a model that has finished a harder job might be expected to help a fresh model with an easier one, and if that were true there would be a genuinely useful shortcut in it: train one model on the hardest job you have and reuse it for everything below.
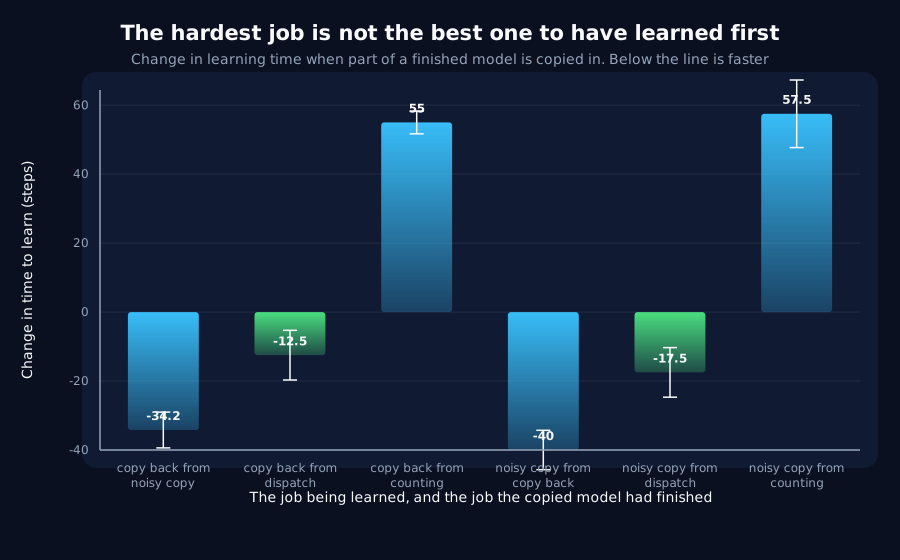
What we found. It does not work. In both cases where the comparison decides anything, the model that had finished the hardest job lost, and lost clearly. What predicts a good donor is not how hard its job was but how closely related that job is to the new one, which we had already measured separately for a different reason.
Why it matters. The part we like about this one is what it cost. The data was already sitting in a file from an earlier experiment; the only thing missing was somebody asking the question. An appealing shortcut that would otherwise have justified weeks of work was ruled out in an afternoon of re-reading. We also say plainly which part of the evidence is weak: with only four jobs, difficulty and relatedness are tangled together, so we lean on the two direct comparisons where the two ideas openly disagree rather than on the overall correlation.
The rest of this page is the technical record: the design, every number, and the limits. It is written for a reviewer, and you do not need it to have understood the result above.
New here? How to read a research record
- Start at the verdict. Every record states, before the experiment was run, what result would have made us abandon the idea. That is the "kill test". Then it says whether the test fired. Nothing gets reinterpreted after the fact.
- Numbers in square brackets are uncertainty.
23.4 [18.1, 28.7]means our best estimate is 23.4 and the true value is probably somewhere in that range. If a range includes zero, we cannot claim an effect. - Results that rule an idea out are kept. Roughly half of what is published here says an approach did not work, including plenty of our own. Those pages are the output, not a shortfall: knowing which direction is a dead end is what lets the next experiment go somewhere better, and most of what we now rely on came out of understanding why something else fell short. Work that only publishes what worked is not measuring anything.
- Read the Limits section. Every record ends with what it does not show. It is the most honest part of any experiment and usually the shortest.
- Pro tip: the figures near the top are designed to carry the result on their own. If you read nothing else, read the caption under each one, which says what it shows and what to take from it.
EXPLORATORY. Not a preregistered study. No new training. Re-analyses committed output.
Program v2 Bucket R, item R3. Decisive computation: analysis/downhill_from_the_harder_task.pyanalysis/downhill_from_the_harder_task.jsonpython analysis/downhill_from_the_harder_task.py.
The question
Q14 found its relatedness measure directional and correct about it: a dispatch donor scores 0.499 on delayed-copy while a delayed-copy donor scores only 0.176 on dispatch, and the transfer effects follow. The natural reading is that a model which has solved the harder task has in effect solved the easier one.
If that generalised there would be a cheap recipe in it: train one donor on the hardest task in a family and it serves everything below it, instead of a donor per receiver. That is a better proposition than anything else in this thread, which is exactly why it should be tested before anyone builds on it.
Kill test, fixed before execution: a donor trained on the hardest task in the family is not the best available donor for the easier ones.
Difficulty is defined without consulting any transfer number: how long each task's own control takes to reach its own level.
| Task | Control reaches its level at |
|---|---|
running-count | 37.5 |
delayed-copy | 86.7 |
noisy-copy | 91.7 |
dispatch-copy-8lag | 122.5 (hardest) |
Prior recorded in advance: the kill test fires. noisy-copy is easier than dispatch and was already visibly the better donor for delayed-copy in Q14's table. The value here is not the headline; it is stopping a plausible recipe before it becomes a research programme.
Result: the hardest task's donor is never the best
| Receiver | Best donor available | Was it the hardest? |
|---|---|---|
delayed-copy | noisy-copy (-34.2) | no, dispatch gave -12.5 |
noisy-copy | delayed-copy (-40.0) | no, dispatch gave -17.5 |
running-count | tied, see below | no |
The two interpretable receivers are clean discriminators, because difficulty and relatedness disagree about them in opposite directions:
- For
delayed-copy,noisy-copyis easier and more related;dispatchis harder and less related. Difficulty predictsdispatchwins. Relatedness predictsnoisy-copy.noisy-copywins by21.7steps. - For
noisy-copy,delayed-copyis easier and more related (0.992);dispatchis harder and less related (0.186).delayed-copywins by22.5steps.
Both times the two orderings make opposite predictions and both times relatedness is right.
The confound this grid has, and why the verdict survives it
Over all twelve cross-task cells, ranked against the transfer effect:
| Ordering | rho |
|---|---|
| donor task difficulty | -0.457 |
| donor relatedness | -0.754 |
Difficulty is not nothing, and that is a confound rather than a finding. In this grid the easiest task, running-count, is also the least related to everything else, because it is the one task whose target no lookup produces. So difficulty is partly a proxy for relatedness here, and -0.457 should not be read as difficulty carrying independent signal.
This is the shape Q8 went wrong on and the reason the per-receiver comparisons above are quoted as the evidence rather than the correlation. Those are within receiver, between two donors on which the two orderings openly disagree, which is the one place a small confounded grid can still decide something.
The row that decides nothing
running-count as a receiver shows +20.8 for all three donors, identically. Q14 established why: its control reaches the level at 37.5 steps while the graft lands at 30, so the row measures graft disruption rather than anything about donors. Its "best donor" is arbitrary.
The kill test fires on the two interpretable receivers alone, so nothing here depends on it, and it is reported rather than quietly dropped.
What stands
- "Train the donor on the hardest task" does not work. The hardest task's donor was not the best for either interpretable receiver, and lost by
21.7and22.5steps. - Relatedness beats difficulty,
rho -0.754against-0.457, and beats it head to head in both comparisons where the two disagree. - Q14's asymmetry is real and does not imply the recipe. A dispatch donor does score higher on
delayed-copythan the reverse. It is still not the best donor available, because a closely related easier task beats a less related harder one. - The recipe is dead for the price of re-reading a file, which is the cheapest possible outcome for an idea that would otherwise have justified a sweep.
Limits
- Four tasks, one of them uninterpretable, so the kill test rests on two receivers. It fires on both, in the same direction, by similar margins.
- The difficulty ladder was not designed. These four tasks were chosen by Q14 for coverage of relatedness, not to span difficulty evenly, and difficulty and relatedness are entangled in them. A designed ladder, where difficulty varies while relatedness is held roughly constant, would test this properly and is what R3 would need to be settled rather than answered.
- No new training means no new evidence. Everything here was implied by Q14's matrix; what was missing was the question. That is worth doing and is not an independent confirmation.
- "Difficulty" here is time-to-criterion for one width and one learning rate. A different operationalisation, such as the plateau a task tops out at, might order the tasks differently.
Terms on this page
Every piece of vocabulary this record uses, in plain language. Generated from the text above, so it cannot drift out of step with it.
- confound
- A second explanation you did not control for. If bigger models both learn faster and score higher, then 'fast learners score higher' may be entirely about size and not about speed.
- kill test
- A condition written down before running the experiment that says what result would make us abandon the idea. Fixing it in advance is what stops a disappointing result being reinterpreted as an encouraging one.
- learning rate
- How big a step training takes each time it updates the model. Too small and nothing happens; too big and it never settles.
- plateau
- A stretch of training where the model is not visibly improving. Often, though not always, followed by a sudden jump.
- settled
- A run has settled when it has stopped improving. Measurements anchored to a run's own best score are unreliable until it has, because that best score is still moving.
- width
- How many internal numbers a model uses at each layer. The usual way we vary model size in these experiments.
Get new results as we publish them
Roughly monthly, one finding per email, in plain English first. Including the approaches that turned out not to work, which are usually the useful ones. No sales email.
Double opt-in: we send a confirmation link and add nobody who does not click it. One-click unsubscribe on every email.