
A Strong Correlation That Meant Nothing
In our research programme we had a question we thought was free to answer: does when a model learns predict how well it ends up performing? We had 183 archived experiments already sitting there. No new compute, no new runs, just a query.
The answer came back immediately and looked decisive. Across the forty-one eligible runs, the correlation between when a model learned and how accurate it finished was -0.679. Strong, negative, and exactly the kind of number that ends up in a slide deck.
It means nothing. Here is how we know.
One variable was driving both
The forty-one runs were not all the same size. They came in three widths: 36, 48 and 72. And model width drives both things we were correlating. Wider models learn earlier, and wider models finish more accurate. Pool them together and you get a strong trend that is really just width wearing a disguise.
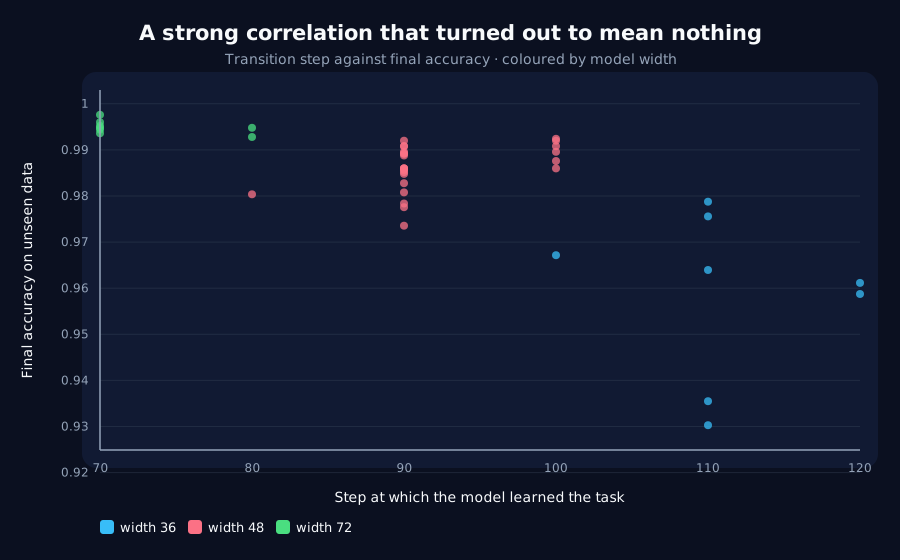
Split the data by width and the finding evaporates:
- Width 36: correlation -0.316
- Width 48: correlation +0.503
- Width 72: correlation -0.444
The signs disagree. One of the three points the opposite way to the pooled number that started all this.
Two more problems underneath
Even the individual pieces cannot support a conclusion, for two reasons that are worth naming because both are common.
The measurement was too coarse. Every archived experiment recorded its progress every ten steps. Within a single width, that leaves only two or three distinct values for "when did it learn", and between 72% and 75% of runs share the same one. A correlation computed over three tied values is a comparison of two or three groups wearing a correlation's clothing.
The outcome had no room to vary. Final accuracy spanned 0.0048 at width 72 and 0.0188 at width 48. When every model finishes between 99.0% and 99.5%, there is almost nothing for timing to predict.
So we recorded the result as not answerable from this data. Not a positive finding, not a null result. The measurement does not have the resolution the question needs, and saying so is the honest output.
In plain English
Suppose you notice that people who eat breakfast earlier tend to be healthier, and the correlation is strong. Then you notice your sample mixed shift workers with retirees. Age drives both the breakfast time and the health. Split by age group and the pattern falls apart, with one group even showing the reverse.
The original number was real arithmetic on real data. It just did not mean what it appeared to mean.
What did survive
The same analysis produced something usable, from the same runs. If width drives the timing so strongly, then timing should be predictable from the settings alone. It is.
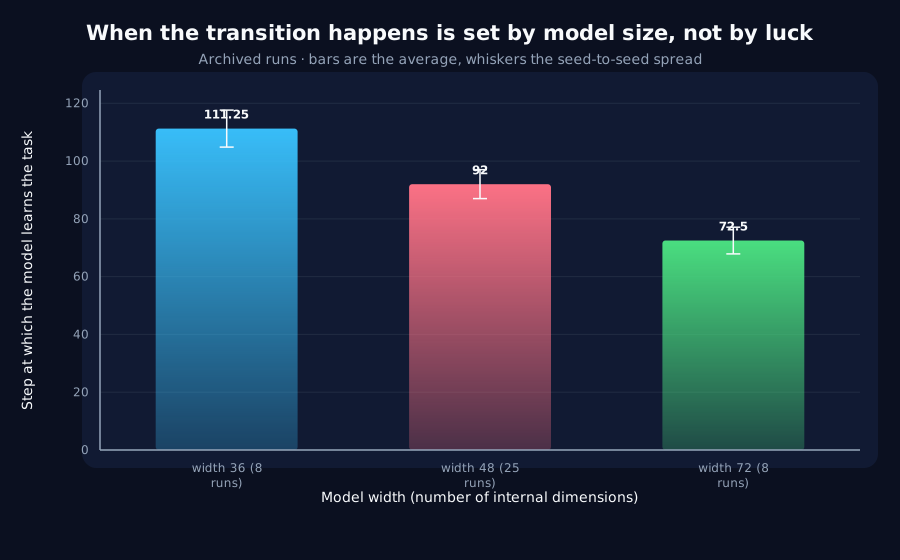
The gap between sizes is about 39 steps. The variation between runs that differ only by random chance is about 5 steps. So the configuration determines the timing roughly seven times more than luck does, and the moment of learning can be predicted in advance from the settings to within about ten steps.
That is a real result, and it came out of the same afternoon as the one we threw away.
The buying lesson
Pooled numbers across mixed configurations are the single most common way an AI benchmark misleads, and it is almost never deliberate. A vendor runs a spread of model sizes, quantisation levels and prompt strategies, aggregates, and reports the trend. The trend is real in the aggregate and can reverse in every subgroup.
Two questions cost nothing to ask and are hard to answer badly:
- What varied between the runs you pooled? If more than one thing varied, the headline correlation is not attributable to any of them.
- How much room did the metric have to move? A claim of no quality loss on a benchmark where everything scores 99% is not evidence of anything. We wrote a separate article about that problem, because we had it too.
Read the full record, including the code that produces every number
Get new results as we publish them
Roughly monthly, one finding per email, in plain English first. Including the approaches that turned out not to work, which are usually the useful ones. No sales email.
Double opt-in: we send a confirmation link and add nobody who does not click it. One-click unsubscribe on every email.