
Three Buckets That Lied to Us
Here is a result we did not publish, and the reason is worth more than the result would have been.
What we were measuring
When a model trains, each step nudges it in some direction. Those nudges partly cancel each other out, so the model ends up travelling less far than the total distance it moved. The cancelled part is wasted computing, and we wanted to know where in training it happens.
Specifically, whether the waste clusters around the moment the model suddenly learns the task. If it did, there would be an obvious place to look for savings.
The plan, written before we ran anything, was to group the measurements into three periods: before the moment of learning, around it, and after.
The three buckets
They came out like this, where a higher number means less waste:
- Before: 0.949
- Around: 0.884
- After: 0.827
Cleanly ordered, with error bars nowhere near overlapping. By every normal standard that is a solid result: waste increases through the phases of training, and the moment of learning sits in the middle of the progression.
We could have written that up. It would have looked good.
What was wrong with it
The three buckets sit at three different points in time. That is what makes them buckets. So anything that changes steadily over training will separate them, whether or not it has the slightest connection to the moment of learning.
The comparison cannot tell the two apart. It produces a clean, ordered, statistically comfortable result in both cases.
So we threw the grouping away, measured at every single step instead, and lined each training run up on its own moment of learning before averaging.
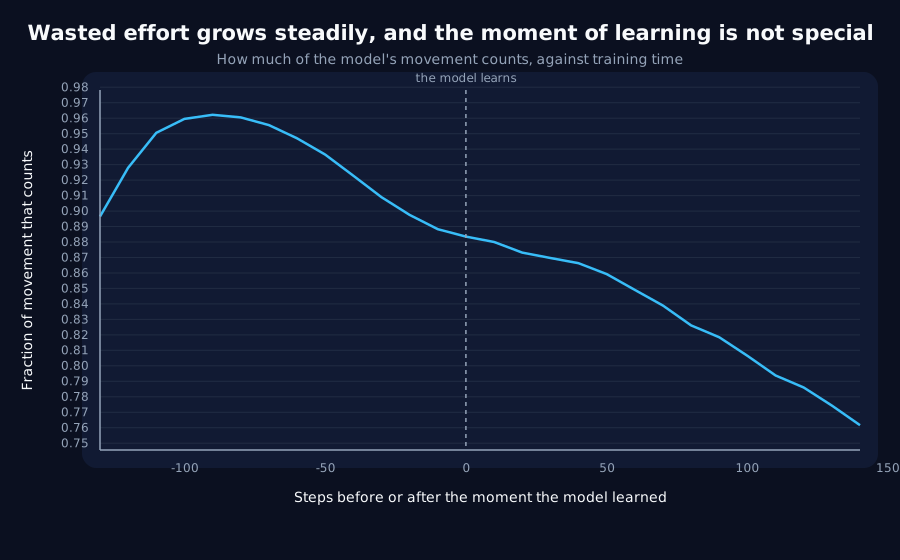
The line falls steadily from beginning to end and does nothing whatsoever at the marked moment. We checked that directly rather than by eye: fitting a trend to everything outside the middle region, the middle region sits on that trend to within a third of the measurement noise.
The waste is real, and it is large. About a fifth of the model's effort stops counting between early training and the end of the window. It simply has nothing to do with learning the task.
In plain English
Imagine measuring people's height in three groups: primary school, secondary school, and university. The groups will differ enormously and the error bars will not overlap. You have not discovered that school phases cause growth. You have discovered that the groups contain people of different ages.
Our three buckets had the same problem. They were labelled by their relationship to an event, and separated by the fact that they sat at different times.
Why this is worth watching for
Before-and-after comparisons are everywhere: before and after a product launch, a policy change, a deployment, a treatment. They are intuitive, easy to explain, and they carry this problem built in whenever the thing being measured also drifts on its own.
Two things make it hard to catch.
- The result looks better, not worse, when it is wrong. Grouping averages away the noise, so a spurious difference arrives with tight error bars and a clean ordering. Nothing in the output signals a problem.
- The grouping usually comes from the plan. Ours was written in advance, which is normally the thing that protects you. Deciding a comparison ahead of time does not make that comparison capable of answering the question.
The fix was not clever and cost nothing extra: measure continuously, line the runs up on the event, and look at the shape. A real effect at the event appears as a feature. Drift appears as a slope. The buckets cannot distinguish those; the curve cannot confuse them.
What we reported instead
Two things, kept separate. That the waste is not connected to the moment of learning, which closed off a line of work we had been considering. And that waste grows steadily throughout training regardless, which is a real finding we would have missed entirely if we had stopped at the buckets and gone hunting for a mechanism at a moment where nothing was happening.
The honest version was more useful than the tidy one.
The full record, with every number and the limits
Get new results as we publish them
Roughly monthly, one finding per email, in plain English first. Including the approaches that turned out not to work, which are usually the useful ones. No sales email.
Double opt-in: we send a confirmation link and add nobody who does not click it. One-click unsubscribe on every email.