
The Waste That Is Not Where You Look
Ongoing research. This is an experimental result from active work, not a settled conclusion. The numbers are what we measured and the method is described so you can judge it, but the programme is still running and later experiments may revise what it means.
A note on the language in these records. This is a working laboratory notebook for research into training AI models more cheaply and efficiently, so you will read that an approach did not work, that a result did not hold up, or that one method was worse than another. That is the research doing its job, not a verdict on the engineering we deliver to clients. Ruling an approach out is how the search narrows, and these are the pages that teach us the most: nearly every technique we now rely on came from understanding why something else fell short. Testing our own ideas at least as hard as anyone else's is the point of publishing them. More about this programme and why we run it.
Part of a bigger question: Which parts of a model actually matter? – The parts that move most are not the parts that matter, and no single component is required -- the model routes around every freeze. What a part is worth shows up only when you remove it.
In plain English
What we asked. As a model trains, its steps partly cancel each other out, so it travels less far than the total distance it moves. That cancelled motion is wasted computing. We wanted to know whether the waste clusters around the moment the model suddenly learns the task, because if it did there would be an obvious place to look for savings.
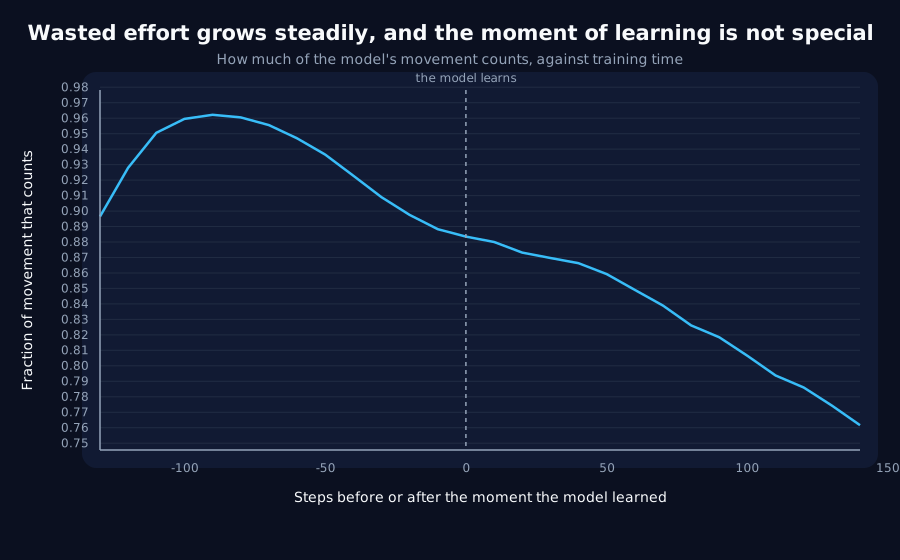
What we found. The waste is real and large: about a fifth of the model's effort stops counting between early training and the end of the window we measured. But it has nothing to do with the moment of learning. It grows steadily and smoothly the whole way through, and the moment of learning sits on that trend like every other point.
Why it matters. This one is mostly a lesson about grouping data. Sorted into the three time periods the original plan asked for, the numbers looked like a strong, clean effect with error bars that did not overlap, and would have been reported as one. The catch is that those three groups sit at different points in time, so anything that drifts over training separates them regardless. Measuring at every step instead, and lining each run up on its own moment of learning, showed the pattern is entirely the drift. Whenever results are reported in before-and-after buckets, it is worth asking what a continuous measurement would have shown.
The rest of this page is the technical record: the design, every number, and the limits. It is written for a reviewer, and you do not need it to have understood the result above.
New here? How to read a research record
- Start at the verdict. Every record states, before the experiment was run, what result would have made us abandon the idea. That is the "kill test". Then it says whether the test fired. Nothing gets reinterpreted after the fact.
- Numbers in square brackets are uncertainty.
23.4 [18.1, 28.7]means our best estimate is 23.4 and the true value is probably somewhere in that range. If a range includes zero, we cannot claim an effect. - Results that rule an idea out are kept. Roughly half of what is published here says an approach did not work, including plenty of our own. Those pages are the output, not a shortfall: knowing which direction is a dead end is what lets the next experiment go somewhere better, and most of what we now rely on came out of understanding why something else fell short. Work that only publishes what worked is not measuring anything.
- Read the Limits section. Every record ends with what it does not show. It is the most honest part of any experiment and usually the shortest.
- Pro tip: the figures near the top are designed to carry the result on their own. If you read nothing else, read the caption under each one, which says what it shows and what to take from it.
EXPLORATORY. Not a preregistered study. Local CPU, 8 training runs, no GPU, no cost.
Program v2 tier 4, item A13. Decisive computation: analysis/update_cancellation.pyanalysis/update_cancellation.jsonpython analysis/update_cancellation.py in about fifteen minutes on a throttled laptop CPU. The numbers below reproduced exactly on a second execution.
The question
Over a sliding window of optimizer steps, measure how much of the parameter motion survives:
`` ||sum of the updates|| / sum of ||each update|| ``
Near 1 means every step pushed the same way and all the motion counted. Near 0 means the steps fought each other and the model walked in place. It is the cheapest instrument in the backlog: it needs only the updates the optimizer is already applying, and windows where updates cancel are compute spent going nowhere.
Kill test, from docs/research-program-v2.md: the fraction is flat across training phases. Then update-level waste is not phase-structured at this scale and B2's payoff estimate drops.
The buckets say "strong phase effect"
The backlog asks for the fraction against training phase. Bucketed exactly as specified:
| Phase | Surviving fraction |
|---|---|
pre-transition (-120 to -40) | 0.9486 [0.9462, 0.9510] |
transition (-20 to +20) | 0.8843 [0.8822, 0.8864] |
consolidation (+40 to +120) | 0.8271 [0.8226, 0.8316] |
Monotone, ordered, and with intervals nowhere near overlapping. Read on its own this is a large, clean phase effect: updates cancel progressively more as training moves through its phases, with the transition sitting in the middle.
It is an artifact of the buckets, and the buckets could not have told anyone that.
The curve says otherwise
The three phases are ordered in time by construction, so any quantity that merely drifts over training will differ between them with nothing to do with the transition. That is the confound D5 needed a second experiment to remove, and here it costs nothing to avoid: compute the fraction at every step, align each seed's curve to its own transition, and average.
| Offset from the transition | Surviving fraction |
|---|---|
-130 | 0.8965 |
-90 | 0.9622 (maximum) |
-60 | 0.9470 |
-30 | 0.9090 |
0 | 0.8835 |
+30 | 0.8697 |
+60 | 0.8490 |
+140 | 0.7617 (minimum) |
Coherence rises through the first sixty steps of training, peaks well before the transition, and then declines steadily for the rest of the run. The extremes are at -90 and +140. Nothing happens at zero.
The direct test
"The extremes are not near zero" is suggestive and indirect: it would also be true of a genuine but modest bump sitting on a steep trend, which is precisely the case worth detecting. So the test is run directly: fit a straight line to the curve excluding the region within 30 steps of the transition, then ask whether that region departs from the fit.
| Quantity | Value |
|---|---|
Trend outside ±30 | -0.0698 per 100 steps |
| Departure of the transition region from that trend | +0.0051 |
| Noise on a single point | 0.0148 |
The transition region sits on the trend to within a third of the noise. There is no feature.
Verdict: the literal kill test and its intent diverge
- Literally, the kill test does not fire. The fraction is emphatically not flat: it moves
0.2005across the measured window, more than thirteen times the noise on a point. - Its intent is answered anyway, and in the negative. The waste is not phase-structured. It is a steady decline in coherence with training time, on which the transition region sits like every other part of the curve. B2's payoff estimate drops.
Reporting only the buckets would have inverted this. That is the same shape as D7, where the transition genuinely responded to noise and the direction of the response refuted the mechanism the response appeared to support: a kill test phrased as "is there an effect" can be satisfied by an effect that means the opposite of what the test was after.
The finding that is not about the transition
Worth recording on its own: coherence declines steadily throughout training, by about 7 percentage points per 100 steps, from 0.96 shortly after the start to 0.76 by the end of the measured window.
Late training genuinely is less efficiently spent than early training, a fifth of the parameter motion stops counting over the span measured here. That is a real, large effect with an obvious practical flavour, and A13 says nothing about whether it can be exploited, only that whatever it is, the transition is not where it lives.
Limits
- One architecture, one task, one width, one learning rate, one batch size, eight seeds, AdamW only.
- The sliding window is 20 steps. A longer window measures cancellation over a longer horizon and would report a lower fraction for the same trajectory; the shape, not the level, is what is claimed here.
- The curve is measured from
-130to+140around transitions landing at steps 144 to 160, so it covers most but not all of a 460-step run. The decline may continue, flatten or reverse outside that span. - The
-130point has a much wider interval than its neighbours ([0.8496, 0.9435]) because the sliding window is only just full there. It is included for completeness and nothing rests on it. - Cancellation is measured over the full parameter vector. A per-component version, following D1's split, might find structure the aggregate hides.
Terms on this page
Every piece of vocabulary this record uses, in plain language. Generated from the text above, so it cannot drift out of step with it.
- AdamW
- A widely used training algorithm that adapts how big a step it takes for each individual parameter. The default in most modern AI training.
- architecture
- The blueprint of a model: what components it has and how they connect. Two models can be the same size and completely different architectures.
- batch size
- How many examples the model looks at before updating itself once. Bigger batches give a steadier but more expensive update.
- confound
- A second explanation you did not control for. If bigger models both learn faster and score higher, then 'fast learners score higher' may be entirely about size and not about speed.
- kill test
- A condition written down before running the experiment that says what result would make us abandon the idea. Fixing it in advance is what stops a disappointing result being reinterpreted as an encouraging one.
- learning rate
- How big a step training takes each time it updates the model. Too small and nothing happens; too big and it never settles.
- optimizer
- The algorithm that decides how to change the model given the gradient. AdamW and SGD are two common choices and they behave differently.
- seed
- The number that fixes all the randomness in a training run. Same seed, same run. Running several seeds is how you tell a real effect from a lucky one.
- width
- How many internal numbers a model uses at each layer. The usual way we vary model size in these experiments.
Get new results as we publish them
Roughly monthly, one finding per email, in plain English first. Including the approaches that turned out not to work, which are usually the useful ones. No sales email.
Double opt-in: we send a confirmation link and add nobody who does not click it. One-click unsubscribe on every email.