
The Loudest Part Is Not the Useful Part
Ongoing research. This is an experimental result from active work, not a settled conclusion. The numbers are what we measured and the method is described so you can judge it, but the programme is still running and later experiments may revise what it means.
A note on the language in these records. This is a working laboratory notebook for research into training AI models more cheaply and efficiently, so you will read that an approach did not work, that a result did not hold up, or that one method was worse than another. That is the research doing its job, not a verdict on the engineering we deliver to clients. Ruling an approach out is how the search narrows, and these are the pages that teach us the most: nearly every technique we now rely on came from understanding why something else fell short. Testing our own ideas at least as hard as anyone else's is the point of publishing them. More about this programme and why we run it.
Part of a bigger question: Which parts of a model actually matter? – The parts that move most are not the parts that matter, and no single component is required -- the model routes around every freeze. What a part is worth shows up only when you remove it.
In plain English
What we asked. Every training step pushes a model in some direction, and that push splits into components. One is far larger than all the others. An earlier experiment of ours showed that deleting the largest component is what damages training, so it is clearly the part that matters. We assumed it would therefore also be the part worth watching if you wanted advance warning that the model was about to learn something.
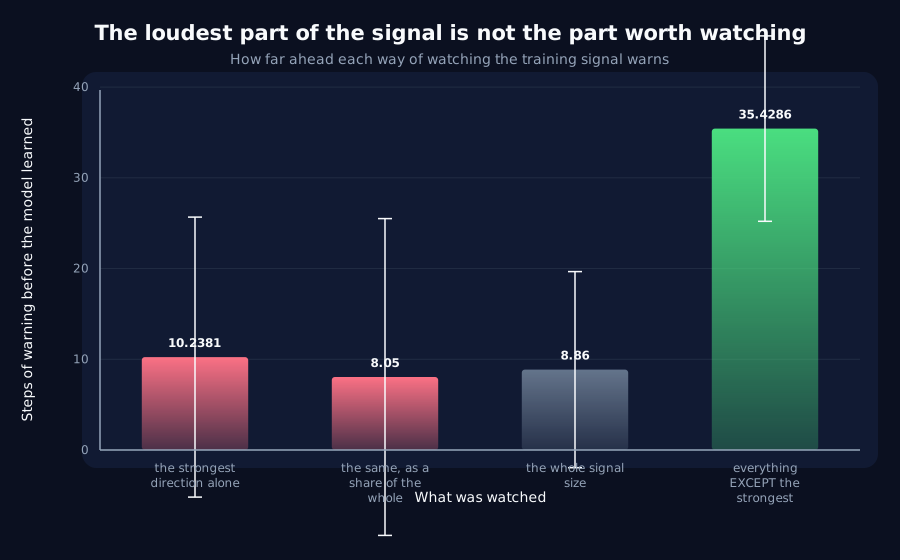
What we found. It is not, and the opposite is true. Watching the largest component gave warning about ten steps ahead and was unreliable enough that it often gave no warning at all. Watching everything except the largest component gave warning about thirty-five steps ahead and did so in nineteen runs out of twenty. It was the only one of sixteen things we tested that survived being checked on a separate set of runs.
Why it matters. The part of a signal that matters most when you remove it is not the part that tells you most when you watch it. That sounds obvious once stated and we had assumed the opposite. The likely reason is that the largest component is doing the steady bulk of the work, so it is smooth and uninformative, while the interesting variation hides in the smaller components where it is not drowned out. There is a caution on this page too: our benchmark measurement underperformed on this particular set of runs, so we rest the conclusion on the comparison between measurements taken side by side rather than on the individual numbers.
The rest of this page is the technical record: the design, every number, and the limits. It is written for a reviewer, and you do not need it to have understood the result above.
New here? How to read a research record
- Start at the verdict. Every record states, before the experiment was run, what result would have made us abandon the idea. That is the "kill test". Then it says whether the test fired. Nothing gets reinterpreted after the fact.
- Numbers in square brackets are uncertainty.
23.4 [18.1, 28.7]means our best estimate is 23.4 and the true value is probably somewhere in that range. If a range includes zero, we cannot claim an effect. - Results that rule an idea out are kept. Roughly half of what is published here says an approach did not work, including plenty of our own. Those pages are the output, not a shortfall: knowing which direction is a dead end is what lets the next experiment go somewhere better, and most of what we now rely on came out of understanding why something else fell short. Work that only publishes what worked is not measuring anything.
- Read the Limits section. Every record ends with what it does not show. It is the most honest part of any experiment and usually the shortest.
- Pro tip: the figures near the top are designed to carry the result on their own. If you read nothing else, read the caption under each one, which says what it shows and what to take from it.
EXPLORATORY. Not a preregistered study. Local CPU, 34 training runs, no GPU, no cost.
Program v2 Bucket G, item G1. Decisive computation: analysis/top_direction_indicator.pyanalysis/top_direction_indicator.jsonpython analysis/top_direction_indicator.py in about fifty minutes on a throttled laptop CPU.
The question
Two results pointed at the same object from different sides, and this is the first Bucket G item, written only because tiers 3 and 4 were re-read as a whole after they closed.
- F4 found the causal weight sits almost entirely in the single leading gradient direction: removing it costs
+35.5steps, while removing sixteen ordinary directions carrying four times the energy costs+16.2. - F1 and A11 found the predictive signal is the rolling variance of the gradient norm, a bulk quantity that knows nothing about direction.
If the top direction is where the causal action is, does watching that direction predict better than watching the whole gradient's size?
Kill test: the top-direction statistics lead by no more than the global norm's variance, under the same controls. Then the leading signal is a bulk property and F4's localisation does not transfer to prediction.
Result: the hypothesis is refuted, and its opposite holds
| Statistic | Lead | Reliability | Slope | r | Passes |
|---|---|---|---|---|---|
top_projection:variance, the top direction | +10.2 [-5.2, 25.7] | 57% | 0.86 | +0.88 | no |
top_share:variance: the same, scale-free | +8.0 [-9.4, 25.5] | 52% | 0.94 | +0.86 | no |
**off_top:variance, everything except it** | +35.4 [25.2, 45.6] | 95% | 0.82 | +0.95 | yes |
global_norm:variance, A11's reference | +8.9 [-2.0, 19.7] | 62% | 1.06 | +0.95 | no |
The kill test fires for the top direction. It leads by +10.2 with an interval crossing zero and comes first in barely more than half of runs, indistinguishable from the global norm it was supposed to beat.
But its complement wins decisively. The variance of everything outside the leading direction leads by +35.4 with an interval clear of zero, arrives first in 95% of runs, and is the only statistic of sixteen tests to pass selection and replicate on held-out seeds. The margin over the top direction itself is +25.2 steps.
What this means
The causal direction and the predictive direction are complementary, not the same.
- F4: removing the top direction is what hurts.
- G1: watching everything except the top direction is what predicts.
A reading consistent with both, and with A13: the leading direction carries the bulk, steady component of learning: large, smooth, and doing the work, which is why deleting it is expensive and why its fluctuations say little. The informative fluctuations live in the smaller directions, where they are not drowned by that bulk. Watching the loudest part of a signal is not the same as watching the part that varies informatively.
This is the second time the programme has separated prominence from usefulness, and in the opposite direction from the first. D1 and A11 found the prominent thing is not the necessary one; F4 found that sometimes it is; G1 finds the necessary thing is not the informative one. Prominence, necessity and predictiveness are three properties, and measuring one tells you nothing about the others.
Two things that weaken this, stated plainly
The positive control does not clear its own bar on this grid. global_norm:variance is A11's winner, carried through unchanged as the reference to beat and as a check that the setup can reproduce a known result. Here it leads +8.9 against A11's +18.9 and fails the 10-step minimum. The grids differ (this one uses batches 32 and 128 where A11 used 32, 64 and 128, with different seeds), and A11 itself established that this statistic's reliability is population-dependent, which is exactly the caveat now attached to F1's record. So the comparison rests on the internal contrast between the top direction and its complement, both measured identically on the same runs, rather than on beating A11's published number.
The first run's verdict said the opposite of its own data. The code classified off_top as a top-direction statistic, so when the complement passed and the top direction did not, the summary announced that the top direction had won. The numbers were right and the sentence was backwards. Fixed, with the cause recorded in the code, and re-run.
Verdict
- G1's hypothesis is dead. The top direction predicts no better than the gradient's size.
off_top:varianceis a new leading indicator, and on this grid the best one measured:+35.4steps at 95% reliability, 1 of 16 tests to survive selection and confirmation.- The causal and predictive directions are complementary, which is a sharper statement than either F4 or A11 makes alone and could not have been made without both.
Limits
- One task, one width, one optimizer, three grid seeds and ten confirmation seeds.
- The top direction is estimated from a 32-gradient buffer and from gradients strictly before the one being described, since a basis including the current gradient would guarantee a large projection by construction. A longer or shorter buffer defines a different direction.
off_topis a residual norm, so it inherits everything the norm does; this record does not establish that the direction structure outside the top one matters, only that what remains after removing the top one varies more informatively.- The weak positive control above is the main reason to treat the absolute leads with caution. The ordering between the four statistics is measured on identical runs and is the claim; the individual numbers are grid-specific.
- Whether
off_top:variancesurvives A11's own grid, where the global norm did clear the bar, is untested and is the obvious next step.
Terms on this page
Every piece of vocabulary this record uses, in plain language. Generated from the text above, so it cannot drift out of step with it.
- gradient
- The direction and amount by which each of a model's internal numbers should change to do slightly better. Training is repeatedly following it.
- held-out
- Data the model was never trained on, kept back specifically to test it. Scoring a model on data it has already seen measures memorisation, not learning.
- kill test
- A condition written down before running the experiment that says what result would make us abandon the idea. Fixing it in advance is what stops a disappointing result being reinterpreted as an encouraging one.
- optimizer
- The algorithm that decides how to change the model given the gradient. AdamW and SGD are two common choices and they behave differently.
- reliability
- How often something works on an individual case, as opposed to how well it does on average. The two can differ a lot, and only one of them tells you what to expect next time.
- residual
- How far the data sits from a proposed description of it, after the description has been fitted as well as it can be. A small residual means the description accounts for what was measured; a large one means something is missing.
- seed
- The number that fixes all the randomness in a training run. Same seed, same run. Running several seeds is how you tell a real effect from a lucky one.
- slope
- How steeply one quantity changes as another does. A slope of one between a warning and the event it predicts means the warning shifts exactly in step with the event.
- variance
- How spread out a set of numbers is. Rising variance in a signal means it is becoming more erratic.
- width
- How many internal numbers a model uses at each layer. The usual way we vary model size in these experiments.
Get new results as we publish them
Roughly monthly, one finding per email, in plain English first. Including the approaches that turned out not to work, which are usually the useful ones. No sales email.
Double opt-in: we send a confirmation link and add nobody who does not click it. One-click unsubscribe on every email.