
An Average Is Not a Guarantee
Ongoing research. This is an experimental result from active work, not a settled conclusion. The numbers are what we measured and the method is described so you can judge it, but the programme is still running and later experiments may revise what it means.
A note on the language in these records. This is a working laboratory notebook for research into training AI models more cheaply and efficiently, so you will read that an approach did not work, that a result did not hold up, or that one method was worse than another. That is the research doing its job, not a verdict on the engineering we deliver to clients. Ruling an approach out is how the search narrows, and these are the pages that teach us the most: nearly every technique we now rely on came from understanding why something else fell short. Testing our own ideas at least as hard as anyone else's is the point of publishing them. More about this programme and why we run it.
Part of a bigger question: Can you tell in advance that a model is about to improve? – Yes, repeatedly and by several independent routes -- a probe on the hidden state, gradient statistics, held-out loss, and which earlier word the prediction leans on. The warnings are real; how far ahead they fire varies a great deal.
In plain English
What we asked. We had found a warning signal that fires before a model suddenly learns a task. This was the follow-up: we tested a dozen more candidates from the same family, and asked a sharper question. Not just whether a warning arrives early on average, but whether you could count on it for the particular training run in front of you.
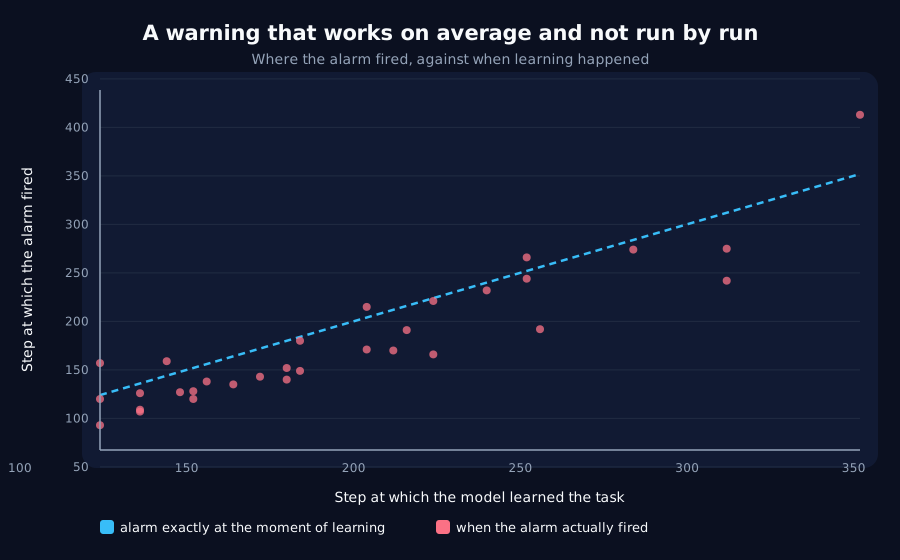
What we found. Two of twenty-four candidates survived, and neither is dependable. The best of them looks perfect by the usual summary: on average it fires about 19 steps early, and the relationship between when it fires and when learning happens is almost exactly one to one, which normally means a reliable fixed warning window. But run by run it arrived too late in five cases out of thirty-one, sometimes by a wide margin.
Why it matters. An average and a guarantee are different products, and the usual way of reporting results hides the difference. An average is useful for reasoning about many runs and useless for deciding what to do about one. We also had to correct ourselves here: an earlier result of ours reported this signal working in every single run, and a follow-up test showed that was true of the particular set of runs we happened to measure rather than of the method. The corrected version is on both pages.
The rest of this page is the technical record: the design, every number, and the limits. It is written for a reviewer, and you do not need it to have understood the result above.
New here? How to read a research record
- Start at the verdict. Every record states, before the experiment was run, what result would have made us abandon the idea. That is the "kill test". Then it says whether the test fired. Nothing gets reinterpreted after the fact.
- Numbers in square brackets are uncertainty.
23.4 [18.1, 28.7]means our best estimate is 23.4 and the true value is probably somewhere in that range. If a range includes zero, we cannot claim an effect. - Results that rule an idea out are kept. Roughly half of what is published here says an approach did not work, including plenty of our own. Those pages are the output, not a shortfall: knowing which direction is a dead end is what lets the next experiment go somewhere better, and most of what we now rely on came out of understanding why something else fell short. Work that only publishes what worked is not measuring anything.
- Read the Limits section. Every record ends with what it does not show. It is the most honest part of any experiment and usually the shortest.
- Pro tip: the figures near the top are designed to carry the result on their own. If you read nothing else, read the caption under each one, which says what it shows and what to take from it.
EXPLORATORY. Not a preregistered study. Local CPU, 46 training runs, no GPU, no cost.
Program v2 tier 4, item A11. Decisive computation: analysis/gradient_indicators.pyanalysis/gradient_indicators.jsonpython analysis/gradient_indicators.py in about fifty minutes on a throttled laptop CPU. The numbers below reproduced exactly on a second execution.
The question, restated
A11 as written asks whether any gradient statistic leads the transition. That question was already answered by F1, whose winner was the rolling variance of the gradient norm. So the kill test cannot fire, and the useful question is a different one:
**Which gradient statistic is the best warning, and does any of them give a fixed horizon?**
F1's lead is proportional, at slope 0.89 it is roughly 11% of the transition time. A statistic tracking at slope near 1.0 with a large constant offset would be a genuinely fixed warning window, which is a more useful object than a proportional one. Statistics are therefore ranked by |1 - slope|, not by lead.
Six per-step series, each in level and rolling-variance form, tested in both directions: global gradient norm, cosine between successive updates, coherence between the two halves of the batch, top singular value of the head gradient, and relative gradient norm for the recurrent and embedding groups. Batch coherence is nearly free, two backward passes over half a batch cost about what one over the whole batch costs, and averaging them gives the identical update.
Two design choices, both earned by earlier records
Quantile thresholds (median + k x IQR of the calibration window) rather than a multiple of its maximum. F1 could not test its autocorrelation statistics at all because a multiple of the maximum is meaningless for a quantity bounded in [-1, 1]. Half the statistics here are cosines, so this was required rather than tidy.
Selection and confirmation on separate run sets. Twelve statistics in two directions is 24 tests, and at a 20% false-alarm rate some pass by chance. The grid selects; ten held-out seeds confirm. This earned its place before the full run: in the smoke test one statistic scored slope 2.36 on selection and -2.98 on confirmation.
The grid drops weight decay entirely, which F1's phase diagram earned by moving it over a hundredfold range and shifting the transition by three tenths of a step.
Result: gradients lead, and 22 of 24 tests do not
| Statistic | Detect | Surrogate | Lead | Slope | r | Alarm first |
|---|---|---|---|---|---|---|
global_norm:variance | 100% | 19% | +18.9 [8.9, 28.8] | 1.01 | +0.92 | 26/31 |
embedding_norm:variance | 100% | 19% | +26.5 [14.6, 38.5] | 0.82 | +0.85 | 23/31 |
recurrent_norm:variance | 97% | 19% | -42.0 | 1.12 | +0.73 | fails |
batch_coherence:level | 19% | 16% | +24.8 | 0.82 | +0.35 | fails |
| … 20 more | fails |
Both survivors replicate 10/10 on the held-out seeds (+34.0 and +31.0). A11's kill test does not fire. The standing constraint moves the other way: it is not that nothing cheap leads, it is that gradient-side statistics lead where geometry does not.
But there is no usable fixed horizon
global_norm:variance tracks at slope 1.01, which is exactly what a fixed warning window looks like, and reporting that alone would be wrong.
Slope is a property of the fit across runs. Reliability is the property a user actually has. On individual runs the alarm arrives after the transition in 5 of 31, and the leads range from -61 to +70 steps.
So the mean lead is real and the per-run guarantee is not. A +18.9 mean with a -61 worst case is not something you can act on, and the script's verdict now says so rather than reporting the slope by itself.
Predictive is not load-bearing, again
embedding_norm:variance is one of the two survivors. D1 found the embedding is cheap to freeze, freezing it costs 0.0017 accuracy, near the bottom of the six groups tested.
So a signal in a component the model does not need still predicts what the model is about to do. D1 recorded that the busiest component is not the necessary one; this is the same dissociation from the other side. Neither motion nor predictive power implies necessity.
The controlled comparison, and a correction to F1
F1 and A11 measure the same underlying quantity and reported materially different detectors:
| Lead | Alarm first | Slope | |
|---|---|---|---|
| F1, multiplicative threshold, F1's runs | +25.5 | 49/49 (100%) | 0.89 |
| A11, quantile threshold, A11's runs | +18.9 | 26/31 (84%) | 1.01 |
The obvious hypothesis is that the threshold rule explains it. That hypothesis is wrong, and testing it cost nothing: both rules can be run over the same 41 runs, which is pure analysis with no retraining.
| Rule, same statistic, same 41 runs | Detect | Lead | Alarm first | Slope | r | Range |
|---|---|---|---|---|---|---|
| quantile | 100% | +20.0 [12.1, 27.8] | 85% | 1.05 | +0.92 | -61 to +70 |
| multiplicative | 100% | +20.0 [14.0, 25.9] | 88% | 0.95 | +0.94 | -19 to +73 |
They are the same detector. Identical mean lead, three points of reliability between them.
Therefore F1's 49 of 49 is a property of its run population, not of its detector. F1 excluded 33 of 82 runs because their transitions landed too early to calibrate against, and every exclusion was a fast cell, so what remained was the slower half, where the alarm has the most room to fire early. On a population that is not filtered that way, the same statistic with the same detector leads in about 85% of runs. F1's numbers are correct for F1's runs. They should not be read as a general reliability, and F1's record now carries this correction.
This is the third time in program v2 that a follow-up control has qualified a headline rather than extending it, and the second time in this tier that the qualification came from asking what the population, rather than the method, was doing.
Verdict
- Gradients lead. Two statistics clear A11's bar (
>= 10steps,|r| >= 0.8) and replicate on unseen seeds. The constraint hardens in the useful direction. - No fixed horizon exists. The best slope is
1.01and the best reliability is 88%, with leads ranging from-61to+70. Every warning this program has found is a distributional statement, not a per-run promise. - F1's reliability figure is population-specific, and the correction is recorded there.
- 22 of 24 tests fail, which is the number the selection-and-confirmation design exists to produce honestly.
Limits
- The confirmation set cannot check slope. Its ten runs share hyperparameters, so their transitions barely move and there is nothing for a slope to track: its
rvalues (+0.38,+0.28) are meaningless and are not used. Confirmation asks only that the lead survives on unseen seeds. - 24 tests at a 20% false-alarm rate. The selection/confirmation split is the control for this, but two survivors out of 24 is close enough to what chance could produce that the replication step, not the selection step, is carrying the claim.
- Both survivors are variance forms; no level statistic passed. Whether that is a fact about gradients or about a detector tuned for rising quantities is not established here.
- One architecture, one task, one width, one optimizer, and AdamW at that, D8 showed timing claims can belong to AdamW alone.
- Transition times are resolved to 4 steps by the evaluation grid.
Terms on this page
Every piece of vocabulary this record uses, in plain language. Generated from the text above, so it cannot drift out of step with it.
- accuracy
- The fraction of answers a model gets right on questions it was not trained on.
- AdamW
- A widely used training algorithm that adapts how big a step it takes for each individual parameter. The default in most modern AI training.
- architecture
- The blueprint of a model: what components it has and how they connect. Two models can be the same size and completely different architectures.
- autocorrelation
- How much a wobbling measurement resembles itself a moment earlier. High autocorrelation means the wobbles are slow and drifting; low means they are fast and jittery.
- calibration
- Working out an instrument's settings from runs whose answer you already know, so it can be used on a run whose answer you do not.
- false-alarm rate
- How often a warning system goes off when nothing is actually happening. Any detector can be made to fire early by making it twitchier, so a lead time only means something alongside this number.
- freezing
- Stopping one part of a model from changing while the rest carries on learning. A way of asking what that part contributes, by taking it away.
- gradient
- The direction and amount by which each of a model's internal numbers should change to do slightly better. Training is repeatedly following it.
- held-out
- Data the model was never trained on, kept back specifically to test it. Scoring a model on data it has already seen measures memorisation, not learning.
- kill test
- A condition written down before running the experiment that says what result would make us abandon the idea. Fixing it in advance is what stops a disappointing result being reinterpreted as an encouraging one.
- optimizer
- The algorithm that decides how to change the model given the gradient. AdamW and SGD are two common choices and they behave differently.
- phase diagram
- A map showing what a system does across combinations of settings, so you can see where behaviour changes rather than testing one point at a time.
- recurrent
- A design that reads a sequence one item at a time, carrying memory forward. The main alternative is attention, which looks at everything at once.
- reliability
- How often something works on an individual case, as opposed to how well it does on average. The two can differ a lot, and only one of them tells you what to expect next time.
- seed
- The number that fixes all the randomness in a training run. Same seed, same run. Running several seeds is how you tell a real effect from a lucky one.
- singular value
- A measure of how much a mathematical operation stretches things along one particular direction. The largest one describes the direction of strongest effect.
- slope
- How steeply one quantity changes as another does. A slope of one between a warning and the event it predicts means the warning shifts exactly in step with the event.
- surrogate
- A fake version of real data, built to keep everything except the effect being tested. If a detector fires just as often on the surrogate, it is responding to something other than what it claims.
- variance
- How spread out a set of numbers is. Rising variance in a signal means it is becoming more erratic.
- weight decay
- A common training setting that gently pulls a model's internal numbers toward zero, used to stop it over-fitting.
- width
- How many internal numbers a model uses at each layer. The usual way we vary model size in these experiments.
Get new results as we publish them
Roughly monthly, one finding per email, in plain English first. Including the approaches that turned out not to work, which are usually the useful ones. No sales email.
Double opt-in: we send a confirmation link and add nobody who does not click it. One-click unsubscribe on every email.