
An Average Is Not a Promise
A while ago we found a way to tell, during training, that an AI model was about to suddenly get much better at its task. We wrote it up. One of the numbers in that write-up was 49 out of 49: in every single run we measured, the warning arrived before the event.
That number was correct. It also did not mean what it looked like, and the follow-up experiment that showed why is more useful than the original result.
What we did next
The obvious follow-up was to look for better warning signals of the same kind. We built twelve candidates, tested each in two directions, and set up the experiment so the results could not flatter themselves:
- Every alarm was tuned against scrambled data first. Take a run, shuffle it so any real build-up is destroyed but the overall character is kept, and set the alarm's sensitivity so it goes off on no more than one in five of those. Otherwise you can make any alarm look early by making it twitchier.
- We split the runs in two. Twenty-four tests at a one-in-five error rate will produce convincing nonsense by chance. So one set of runs was used to pick the winners, and a completely separate set, never looked at during picking, had to confirm them.
That second precaution earned its place immediately. In an early trial run, one candidate looked strongly positive on the picking set and reversed direction entirely on the confirming set.
Two of the twenty-four survived both.
The winner looked perfect
The best survivor fires about 19 steps before the model learns. Better still, the relationship between when it fires and when learning happens is almost exactly one to one. In this kind of work that normally means you have a dependable fixed warning window: however long the run takes, you get roughly the same amount of notice.
Then we looked at the individual runs.
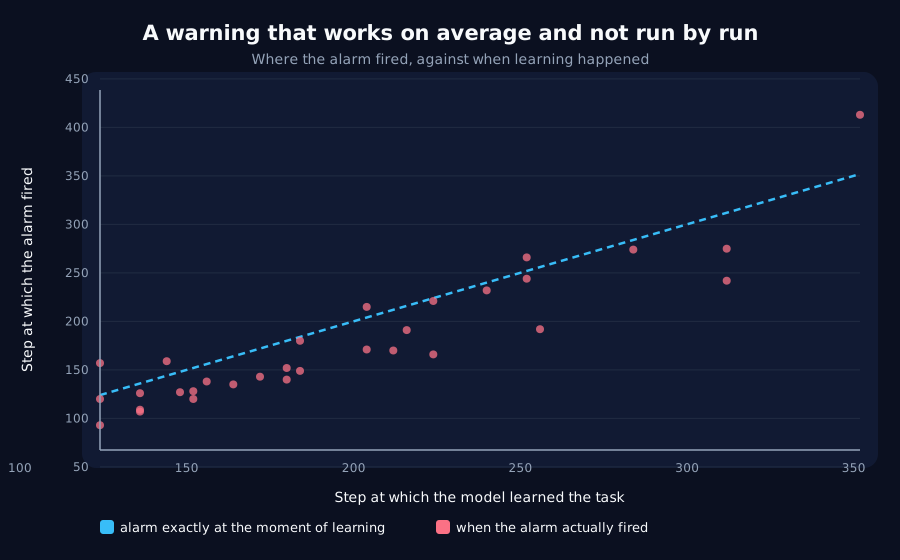
The alarm arrived too late in five runs out of thirty-one. Across the set, the warning time ranged from 61 steps too late to 70 steps early.
The average was real. The promise was not. And nothing in the usual summary, neither the average nor the near-perfect one-to-one relationship, would have told you that.
In plain English
A bus route with an average wait of five minutes might mean a bus every five minutes, or three buses at once and then nothing for a quarter of an hour. Same average, completely different thing to plan your morning around.
Averages are for reasoning about many cases. Guarantees are for deciding what to do about the one in front of you. Most reporting gives you the first and lets you assume the second.
Then we corrected ourselves
This left an obvious problem. Our earlier result said the same underlying signal worked in 49 runs out of 49. The new one said it fails about one time in seven. Both were measured carefully. Both could not be right about the same thing.
The tempting explanation was that the two experiments set their alarms differently, using two different rules for deciding how sensitive to be. That would have been a tidy story about one method being better.
It was also testable for free, because the comparison needs no new training runs: just apply both rules to the same set of runs and see whether they disagree.
They did not. Run side by side on identical data, the two rules gave the same average warning time to one decimal place and reliability within three percentage points of each other. The method was never the difference.
What the difference actually was
The runs.
Our original experiment had to discard about 40% of its runs for a technical reason: a warning signal needs some history to calibrate against, so runs where the model learned very early could not be tested at all. Every discarded run was a fast one. What survived was the slower half, and in a slow run a warning has the most room to arrive comfortably early.
So 49 out of 49 was a property of which runs were left, not of the method that measured them. On a set of runs not filtered that way, the same signal with the same detector gets it right about six times in seven.
Both write-ups now carry the correction. The original's average warning time and its main finding still stand; the reliability figure does not generalise, and it no longer claims to.
Why this is worth your attention
The specific numbers are ours. The shape of the mistake is everywhere.
- Anything you had to exclude is a selection effect. Our exclusions were principled, documented, and had nothing to do with the outcome we were measuring. They still changed the headline number, because what gets excluded is rarely a random sample of what you started with.
- "Works every time" deserves the question "out of how many, and which ones?" A perfect record on a filtered set is not a perfect record.
- Test the tidy explanation before believing it. Ours cost nothing to check and was wrong. If we had reasoned about it rather than measuring it, we would have written a confident paragraph about detector design that was pure invention.
None of this needed new data or new equipment. It needed one more experiment after the one that produced the pleasing number.
The full record, with every number and the limits
The earlier result, now carrying the correction
Get new results as we publish them
Roughly monthly, one finding per email, in plain English first. Including the approaches that turned out not to work, which are usually the useful ones. No sales email.
Double opt-in: we send a confirmation link and add nobody who does not click it. One-click unsubscribe on every email.