
Two Warnings That Know the Same Thing
Ongoing research. This is an experimental result from active work, not a settled conclusion. The numbers are what we measured and the method is described so you can judge it, but the programme is still running and later experiments may revise what it means.
A note on the language in these records. This is a working laboratory notebook for research into training AI models more cheaply and efficiently, so you will read that an approach did not work, that a result did not hold up, or that one method was worse than another. That is the research doing its job, not a verdict on the engineering we deliver to clients. Ruling an approach out is how the search narrows, and these are the pages that teach us the most: nearly every technique we now rely on came from understanding why something else fell short. Testing our own ideas at least as hard as anyone else's is the point of publishing them. More about this programme and why we run it.
Part of a bigger question: Can you tell in advance that a model is about to improve? – Yes, repeatedly and by several independent routes -- a probe on the hidden state, gradient statistics, held-out loss, and which earlier word the prediction leans on. The warnings are real; how far ahead they fire varies a great deal.
In plain English
What we asked. Models on this task suddenly get much better at around step 270, and we have found two separate ways to see it coming: reading what the model's internal state already knows, and watching how much its learning signal wobbles. Neither is reliable on its own. The obvious next move, and the one any engineer would try, is to require both to agree before sounding an alarm.
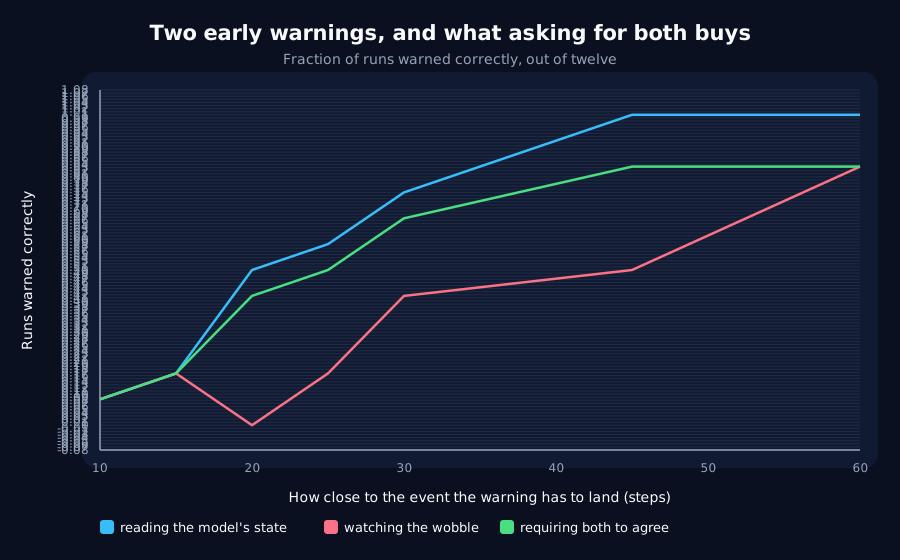
What we found. It buys nothing. At every level of precision we tested, demanding both signals never beat the better single one, and often did worse. The reason turns out to be almost mathematical: if you wait for both, you are waiting for the slower one, so you can never do better than whichever of the two is worse on that particular run. In 106 of the 121 settings we tried, the combined rule was not really a combination at all, it was one of the two signals under a different name.
Why it matters. The finding worth taking away is the other one. We already knew the better signal arrives about 24 steps early on average. What this shows is how little that average promises: it warns correctly in every run only if you accept a 45-step window, in 7 runs out of 12 if you insist on 25, and in 1 out of 12 at ten steps. An average lead is not a guarantee, and anyone planning to act on a signal like this needs the spread, not the mean.
The rest of this page is the technical record: the design, every number, and the limits. It is written for a reviewer, and you do not need it to have understood the result above.
New here? How to read a research record
- Start at the verdict. Every record states, before the experiment was run, what result would have made us abandon the idea. That is the "kill test". Then it says whether the test fired. Nothing gets reinterpreted after the fact.
- Numbers in square brackets are uncertainty.
23.4 [18.1, 28.7]means our best estimate is 23.4 and the true value is probably somewhere in that range. If a range includes zero, we cannot claim an effect. - Results that rule an idea out are kept. Roughly half of what is published here says an approach did not work, including plenty of our own. Those pages are the output, not a shortfall: knowing which direction is a dead end is what lets the next experiment go somewhere better, and most of what we now rely on came out of understanding why something else fell short. Work that only publishes what worked is not measuring anything.
- Read the Limits section. Every record ends with what it does not show. It is the most honest part of any experiment and usually the shortest.
- Pro tip: the figures near the top are designed to carry the result on their own. If you read nothing else, read the caption under each one, which says what it shows and what to take from it.
EXPLORATORY. Not a preregistered study. Local CPU, 18 training runs, no GPU, no cost.
Program v2 Bucket G, item G6. Decisive computation: analysis/ensemble_indicators.pyanalysis/ensemble_indicators.jsonpython analysis/ensemble_indicators.py in about thirty minutes on a throttled laptop CPU, or re-decide any threshold, horizon or alarm rule from the saved series in seconds with python analysis/ensemble_indicators.py --reuse.
The question
This programme has two leading indicators and neither is usable. F2's decode probe leads behaviour by +23.5 steps; F1's gradient-norm variance by +25.5. But A11 established that both are distributional: the same statistic led in 100% of one run population and 85% of another. A signal that is usually early is not something anyone can act on.
The standard way to buy a per-run guarantee is to require two signals from different classes to agree. G6 runs both on the same models and compares the conjunction against the better single indicator at a matched false-alarm rate.
Kill test: the conjunction's reliability is no better than the better single indicator's at matched false-alarm rate. Then the two are measuring the same underlying event and combining them buys nothing.
How an alarm is scored
Fixed before any sweep, and identical for every rule. Given a horizon H, one alarm per run is:
| Outcome | Condition |
|---|---|
| useful | fires before the transition, and within H steps of it |
| premature | fires before the transition, more than H steps early |
| missed | never fires, or fires at or after the transition |
Premature and useful are both alarms, so no rule can improve its hit rate by alarming indiscriminately without paying for it. Thresholds are calibrated on each run's own early history (steps 20–100), which is all a live detector would have. Operating points are chosen on 6 selection seeds and evaluated on 12 disjoint confirmation seeds. Transition at 268.8 mean; learning rate 0.001, screened on two further excluded seeds.
Result: the kill test fires at every horizon
| Horizon | Reading the state (F2) | Watching the wobble (F1) | Both must agree | Either may fire |
|---|---|---|---|---|
| 10 | 1/12 | 1/12 | 1/12 | 1/12 |
| 15 | 2/12 | 2/12 | 2/12 | 2/12 |
| 20 | 6/12 | 0/12 | 5/12 | 0/12 |
| 25 | 7/12 | 2/12 | 6/12 | 2/12 |
| 30 | 9/12 | 5/12 | 8/12 | 5/12 |
| 45 | 12/12 | 6/12 | 10/12 | 6/12 |
| 60 | 12/12 | 10/12 | 10/12 | 10/12 |
The conjunction is never better than the decode probe alone, and at four of seven horizons it is worse. Sweeping every rule's whole threshold grid and reading each at a matched false-alarm rate gives the same answer: 0.58 against 0.58 at the headline horizon of 25 steps, 1.00 against 1.00 at 45, identical at every point tested.
Why, mechanically: a conjunction alarms at the later of its two components, so it is bounded above by the worse of them on each run. The two are ordered consistently enough that in 106 of the 121 threshold pairs the conjunction's alarm vector is identical to one component's, the rule is a single indicator wearing a second name. At the 15 genuinely-combined points it ties the probe with a shorter lead (14.1 steps against 15.7 at horizon 25).
The two are not perfectly synchronous, the probe fires +4.2 steps [-8.5, +16.8] after the gradient statistic, correlation +0.481, so this is not two copies of one measurement. They are moderately correlated and combining them still buys nothing.
The more useful finding is what the sweep exposed about the singles
Neither indicator is a per-run guarantee at any demanding horizon, and the published leads conceal that:
- The decode probe warns every run correctly only if a 45-step window is acceptable, 17% of the way through a 269-step run.
- Tighten to 25 steps, the size of the published lead itself, and it is right 7 times in 12, with 5 premature.
- Tighten to 10 steps and it is right once in 12.
F2's +23.5 steps is a mean over a distribution wide enough that an alarm placed at 25 steps is wrong about as often as it is right. That is A11's "distributional, not per-run" made quantitative, and it is the number anyone proposing to act on these indicators needs.
Two corrections this run forced, both before the result
The first run fixed the horizon at 60 steps, at which every rule scored a perfect 12/12 with zero false alarms. The kill test fired, against a ceiling. With a single indicator already perfect there was nothing an ensemble could add, and "the two measure the same event" was indistinguishable from "the test was too easy". The horizon is now swept and every point reported.
Ties in operating-point selection broke toward the longest lead, which prefers the loosest threshold. On a saturated selection metric that chose a gradient threshold of 0.6, a rule that always fires, so the reported "conjunction" was the decode probe, and matched it to three decimal places. That coincidence is what gave it away. Ties now break toward the strictest thresholds.
The second correction exposed the trap underneath both: a two-signal rule's grid contains its own components as degenerate points, so a conjunction can never score below the better single one, and a tie is arithmetic rather than evidence. Two attempts to detect that from the thresholds failed: asking whether a component fires at the earliest possible step, then whether it does so on its own step grid, because a component can fire late enough to be legal and early enough never to be the maximum. The check only works when applied to the rule: does its alarm vector ever differ from each component's? That is one comparison, and it is what the reported column uses.
Verdict
- The kill test fires. At no horizon from 10 to 60 steps does requiring both indicators to agree beat the better single indicator at a matched false-alarm rate.
- They are measuring the same event. Not the same measurement: they are only moderately correlated, but the same underlying moment, closely enough that their conjunction is usually literally one of them.
- Ensembling is closed as a route to a per-run guarantee for this pair.
- The decode probe is the better indicator by a wide margin and should be the one cited:
12/12at horizon 45 with zero false alarms, against the gradient statistic's6/12. - The usable claim is narrower than the published lead suggests: reliable warning requires accepting a window of about 45 steps.
Limits
- One task, one width, one architecture, one learning rate, 18 runs. The learning rate was screened to place the transition clear of the calibration window, which makes it slower than F2's.
- Two indicators, one combination rule. A conjunction and a disjunction are the two simplest ways to combine alarms; a fitted combiner (logistic regression on both series) is a different experiment and is not ruled out by this one. It would need its own selection/confirmation split and would be much easier to overfit on twelve runs.
- The three-way outcome rule charges a premature alarm as a false alarm at any earliness. A user who tolerates early warnings but not late ones would score these rules differently, and the raw series are saved so that can be recomputed without retraining.
- The gradient statistic here uses a 20-step rolling window against F1's 30, because the calibration window has to fit before the transition. That is a difference from F1's configuration, and the gradient arm's weaker showing should be read with it in mind.
Terms on this page
Every piece of vocabulary this record uses, in plain language. Generated from the text above, so it cannot drift out of step with it.
- architecture
- The blueprint of a model: what components it has and how they connect. Two models can be the same size and completely different architectures.
- calibrated
- A model is calibrated when its confidence matches how often it is right: answers it gives with 90% confidence should be right about 90% of the time.
- calibration
- Working out an instrument's settings from runs whose answer you already know, so it can be used on a run whose answer you do not.
- false-alarm rate
- How often a warning system goes off when nothing is actually happening. Any detector can be made to fire early by making it twitchier, so a lead time only means something alongside this number.
- gradient
- The direction and amount by which each of a model's internal numbers should change to do slightly better. Training is repeatedly following it.
- kill test
- A condition written down before running the experiment that says what result would make us abandon the idea. Fixing it in advance is what stops a disappointing result being reinterpreted as an encouraging one.
- learning rate
- How big a step training takes each time it updates the model. Too small and nothing happens; too big and it never settles.
- probe
- A small separate model trained to read information out of a bigger model's internals, used as a measuring instrument rather than as a product.
- reliability
- How often something works on an individual case, as opposed to how well it does on average. The two can differ a lot, and only one of them tells you what to expect next time.
- seed
- The number that fixes all the randomness in a training run. Same seed, same run. Running several seeds is how you tell a real effect from a lucky one.
- variance
- How spread out a set of numbers is. Rising variance in a signal means it is becoming more erratic.
- width
- How many internal numbers a model uses at each layer. The usual way we vary model size in these experiments.
Get new results as we publish them
Roughly monthly, one finding per email, in plain English first. Including the approaches that turned out not to work, which are usually the useful ones. No sales email.
Double opt-in: we send a confirmation link and add nobody who does not click it. One-click unsubscribe on every email.