
The Warning Is a Share of the Run
Ongoing research. This is an experimental result from active work, not a settled conclusion. The numbers are what we measured and the method is described so you can judge it, but the programme is still running and later experiments may revise what it means.
A note on the language in these records. This is a working laboratory notebook for research into training AI models more cheaply and efficiently, so you will read that an approach did not work, that a result did not hold up, or that one method was worse than another. That is the research doing its job, not a verdict on the engineering we deliver to clients. Ruling an approach out is how the search narrows, and these are the pages that teach us the most: nearly every technique we now rely on came from understanding why something else fell short. Testing our own ideas at least as hard as anyone else's is the point of publishing them. More about this programme and why we run it.
Part of a bigger question: Can you tell in advance that a model is about to improve? – Yes, repeatedly and by several independent routes -- a probe on the hidden state, gradient statistics, held-out loss, and which earlier word the prediction leans on. The warnings are real; how far ahead they fire varies a great deal.
In plain English
What we asked. We can read a model's internal state and tell that it is about to get much better at its task. An earlier experiment showed the catch: how far ahead that warning arrives varies a lot from run to run, and a warning you cannot rely on is not much use. But if we could predict which runs get a long warning and which get a short one, it would become useful again. So we looked for anything measurable very early in training, long before anything happens, that tells us how much warning this particular run will give.
What we found. Nothing did. We tested seven different early measurements against eighteen runs and none of them predicted anything, once we accounted properly for the fact that testing seven things gives you seven chances to get lucky. The one we most expected to work, a head start the model already has before training begins, predicted nothing at all.
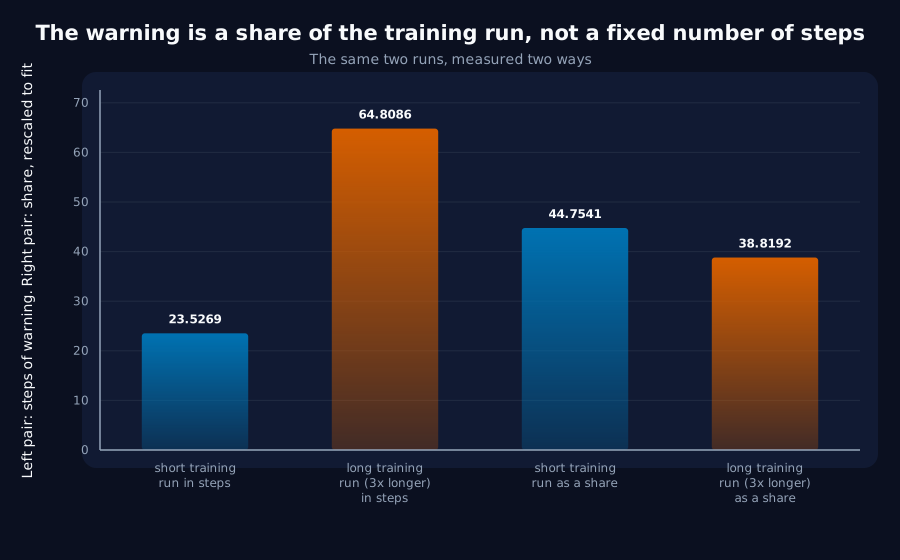
Why it matters. The useful discovery came from a check we had built to keep ourselves honest. The warning is the gap between two moments, and we wanted to be sure we were not just predicting the second one. It turned out that almost all the variation comes from that second moment moving around, while the warning itself is remarkably steady. That led us to compare runs trained about three times longer, and the warning scaled with them: measured in steps the two disagree by nearly three times, measured as a share of the run they nearly agree. So we had been quoting it in the wrong unit. It is not twenty-odd steps, it is about a quarter of the way through training, and anyone who trained for a different length and expected twenty-odd steps would have been misled by us. None of this needed a single new training run.
The rest of this page is the technical record: the design, every number, and the limits. It is written for a reviewer, and you do not need it to have understood the result above.
New here? How to read a research record
- Start at the verdict. Every record states, before the experiment was run, what result would have made us abandon the idea. That is the "kill test". Then it says whether the test fired. Nothing gets reinterpreted after the fact.
- Numbers in square brackets are uncertainty.
23.4 [18.1, 28.7]means our best estimate is 23.4 and the true value is probably somewhere in that range. If a range includes zero, we cannot claim an effect. - Results that rule an idea out are kept. Roughly half of what is published here says an approach did not work, including plenty of our own. Those pages are the output, not a shortfall: knowing which direction is a dead end is what lets the next experiment go somewhere better, and most of what we now rely on came out of understanding why something else fell short. Work that only publishes what worked is not measuring anything.
- Read the Limits section. Every record ends with what it does not show. It is the most honest part of any experiment and usually the shortest.
- Pro tip: the figures near the top are designed to carry the result on their own. If you read nothing else, read the caption under each one, which says what it shows and what to take from it.
CORRECTION, 2026-08-25: the headline holds at width 48 and does not generalise across width. J5 swept width 16 to 192 and found the fraction varies by76.6%across sizes while the step count varies by29.3%, against8.5%seed noise, so the step count is the stabler of the two, which is the opposite of what this record concluded. Width 48 reproduces this record exactly (0.276), so the disagreement is about scope, not measurement. The mechanism J5 found: the probe's own crossing collapses from step301.6at width 16 to step5.5at width 192, which is F3's reservoir effect scaling with size. The fraction rises because its denominator shrinks and the probe fires ever earlier, not because the lead grows. Read "quote it as a share of training" as "quote it with the width". The rest of this record, including the null on early predictors, is unaffected.
EXPLORATORY. Not a preregistered study. Local CPU, no training at all, no GPU, no cost.
Program v2 Bucket I, item I2. Decisive computation: analysis/lead_predictors.pyanalysis/lead_predictors.jsonpython analysis/lead_predictors.py, reading the series G6 committed and the summaries I1 committed.
The question
G6's real finding was the spread: the decode probe warns 12 of 12 runs at a 45-step horizon, 7 of 12 at 25, the size of its own published lead, and 1 of 12 at 10. An indicator with a wide per-run spread is unusable. An indicator whose spread is predictable is usable again, because the alarm can be conditioned on whatever predicts it.
Kill test: no early quantity correlates with the per-run lead beyond seed noise. Then the spread is irreducible and the 45-step window is the honest claim.
Result: the kill test fires
Seven quantities, all computed at or before step 100: what a live detector would have, and 170 steps before the transition, against the per-run lead across 18 runs:
| Predictor | r vs lead | r vs probe crossing | r vs model crossing |
|---|---|---|---|
| gradient norm, calibration mean | -0.298 | -0.401 | -0.480 |
| model accuracy, calibration mean | -0.219 | +0.119 | -0.076 |
| probe accuracy, calibration slope | +0.076 | -0.091 | -0.007 |
| gradient variance, calibration mean | +0.072 | -0.090 | -0.009 |
| probe accuracy, calibration mean | -0.067 | +0.059 | -0.008 |
| probe minus model, calibration mean | +0.058 | -0.002 | +0.039 |
| probe accuracy at step 1 | +0.009 | +0.106 | +0.077 |
Family-wise 95% critical value: 0.598, from 20,000 permutations taking the largest absolute correlation across all seven predictors per draw. Seven predictors against eighteen runs will produce a "significant" correlation by chance, so the null a predictor has to beat is the best that noise produces, not the average. Nothing comes close.
Notably, the probe's own step-1 reading predicts nothing (r = +0.009). That was the most natural candidate: F2 observed the probe already reads 0.1761 against the model's 0.0368 at step 1, and F3 explained it as a reservoir effect. If that head start varied usefully between runs, the lead would vary with it. It does not.
The confound check is the more useful half
The design tested the obvious confound rather than assuming it away: the lead is model crossing - probe crossing, so if the probe's crossing barely moves, predicting the lead is really predicting when the model learns.
That is exactly what is happening, and it is worth more than the null:
| Value | |
|---|---|
| lead vs model crossing | +0.743 |
| lead vs probe crossing | +0.049 |
| spread of probe crossing | 7.0 steps |
| spread of model crossing | 10.4 steps |
The probe's crossing time is the stable one. Run-to-run variation in "how much warning you get" comes almost entirely from the event moving, not from the warning moving. The probe is closer to a clock than to a variable-quality forecaster.
And the lead is not a step count
That reframing is testable against runs at a different learning rate, because I1's arms sit at a transition near 85 and G6's near 270, a factor of about three:
| Configuration | Transition | Lead | Lead as a fraction of the transition |
|---|---|---|---|
AdamW, lr 0.001 (G6, 18 runs) | 270.0 | +64.8 | 0.240 |
AdamW, lr 0.005 (I1/F2, 5 runs) | 85.2 | +23.5 | 0.276 |
SGD, lr 1.6 | 86.0 | +32.4 | 0.377 |
SGD + momentum, lr 0.2 | 81.1 | +25.1 | 0.309 |
Under AdamW, a 3.2x change in the time to the transition changes the absolute lead by 2.8x and the fraction by 15%. Within G6's population the fraction also varies less than the lead does (8.8% against 11.4%).
So F2's headline +23.5 steps is better read as "about a quarter of the way through training". That is a different claim with different consequences: the warning does not shrink to nothing on longer runs, and quoting it in steps will mislead anyone who trains for a different length.
It also sharpens I1. I1 recorded the larger SGD lead as unexplained, noting the arms differ in learning rate as well as optimizer. The transitions turn out to be nearly matched (86.0 against 85.2), so SGD's larger lead is not a longer-training-run effect: the fraction itself is larger (0.377 against 0.276). The learning-rate confound still blocks attributing that to the optimizer, but "it is just a later transition" is now ruled out.
Verdict
- The kill test fires. No early quantity predicts the per-run lead. Conditioning the alarm on an early reading is not available, and G6's 45-step window stands as the honest operating point.
- The spread is mostly not the probe's. It is the transition moving, and the probe's own timing is the more stable of the two.
- The lead should be quoted as a share of training, not a step count. Roughly
0.24–0.28of the time to the transition under AdamW across a threefold change in training length. - This costs nothing to have found. It is entirely a re-analysis of series two earlier pilots committed, which is the argument for the standing rule that says to save them.
Limits
- 18 runs, one task, one width, one architecture. The family-wise null is honest about seven predictors, but with
n = 18the test only has power against fairly strong relationships, a real correlation of0.3would not be detected here. The null is "nothing strong", not "nothing". - Seven predictors is not all predictors. Everything here is a summary of the two logged series. The initialisation spectrum, the weight norms and anything requiring a re-run were not available and are the obvious next candidates.
- The scaling table has four configurations and only two learning rates, one of them with five runs. "The fraction is stable across training length" rests on two AdamW points and should be treated as a hypothesis with supporting evidence rather than an established scaling law.
- The fraction differs by optimizer (
0.24–0.28AdamW,0.31–0.38SGD family), and the arms differ in learning rate too, so nothing here attributes that difference to the optimizer.
Terms on this page
Every piece of vocabulary this record uses, in plain language. Generated from the text above, so it cannot drift out of step with it.
- accuracy
- The fraction of answers a model gets right on questions it was not trained on.
- AdamW
- A widely used training algorithm that adapts how big a step it takes for each individual parameter. The default in most modern AI training.
- architecture
- The blueprint of a model: what components it has and how they connect. Two models can be the same size and completely different architectures.
- calibration
- Working out an instrument's settings from runs whose answer you already know, so it can be used on a run whose answer you do not.
- confound
- A second explanation you did not control for. If bigger models both learn faster and score higher, then 'fast learners score higher' may be entirely about size and not about speed.
- gradient
- The direction and amount by which each of a model's internal numbers should change to do slightly better. Training is repeatedly following it.
- kill test
- A condition written down before running the experiment that says what result would make us abandon the idea. Fixing it in advance is what stops a disappointing result being reinterpreted as an encouraging one.
- learning rate
- How big a step training takes each time it updates the model. Too small and nothing happens; too big and it never settles.
- momentum
- Keeping part of each previous training step in the next one, so training keeps moving in a consistent direction instead of zig-zagging.
- optimizer
- The algorithm that decides how to change the model given the gradient. AdamW and SGD are two common choices and they behave differently.
- probe
- A small separate model trained to read information out of a bigger model's internals, used as a measuring instrument rather than as a product.
- seed
- The number that fixes all the randomness in a training run. Same seed, same run. Running several seeds is how you tell a real effect from a lucky one.
- SGD
- Stochastic Gradient Descent. The simplest training algorithm: take a step in the direction the gradient points, every time, with no adaptation.
- slope
- How steeply one quantity changes as another does. A slope of one between a warning and the event it predicts means the warning shifts exactly in step with the event.
- variance
- How spread out a set of numbers is. Rising variance in a signal means it is becoming more erratic.
- width
- How many internal numbers a model uses at each layer. The usual way we vary model size in these experiments.
Get new results as we publish them
Roughly monthly, one finding per email, in plain English first. Including the approaches that turned out not to work, which are usually the useful ones. No sales email.
Double opt-in: we send a confirmation link and add nobody who does not click it. One-click unsubscribe on every email.