
Our Early Warning Gets Worse as Models Grow
Ongoing research. This is an experimental result from active work, not a settled conclusion. The numbers are what we measured and the method is described so you can judge it, but the programme is still running and later experiments may revise what it means.
A note on the language in these records. This is a working laboratory notebook for research into training AI models more cheaply and efficiently, so you will read that an approach did not work, that a result did not hold up, or that one method was worse than another. That is the research doing its job, not a verdict on the engineering we deliver to clients. Ruling an approach out is how the search narrows, and these are the pages that teach us the most: nearly every technique we now rely on came from understanding why something else fell short. Testing our own ideas at least as hard as anyone else's is the point of publishing them. More about this programme and why we run it.
Part of a bigger question: Can you tell in advance that a model is about to improve? – Yes, repeatedly and by several independent routes -- a probe on the hidden state, gradient statistics, held-out loss, and which earlier word the prediction leans on. The warnings are real; how far ahead they fire varies a great deal.
In plain English
What we asked. We can read a model's internal state and tell that it is about to get much better at its task. That is the one genuinely useful instrument this project has produced. A few write-ups ago we reported that the warning should be described as a share of the training run rather than as a number of steps, because the share stayed steady when we trained for different lengths. We had only ever checked that at one model size.
What we found. It does not hold across sizes. We tested five, from very small to twelve times larger, and the share ranged from about seven percent of the run to about eighty-four. Measured in steps it moved far less. So our recommended way of describing the warning was the worse of the two, and we have added a correction to that earlier write-up. Reassuringly, the size we originally tested reproduced exactly, so the two results agree about the measurement and disagree only about how widely it applies.
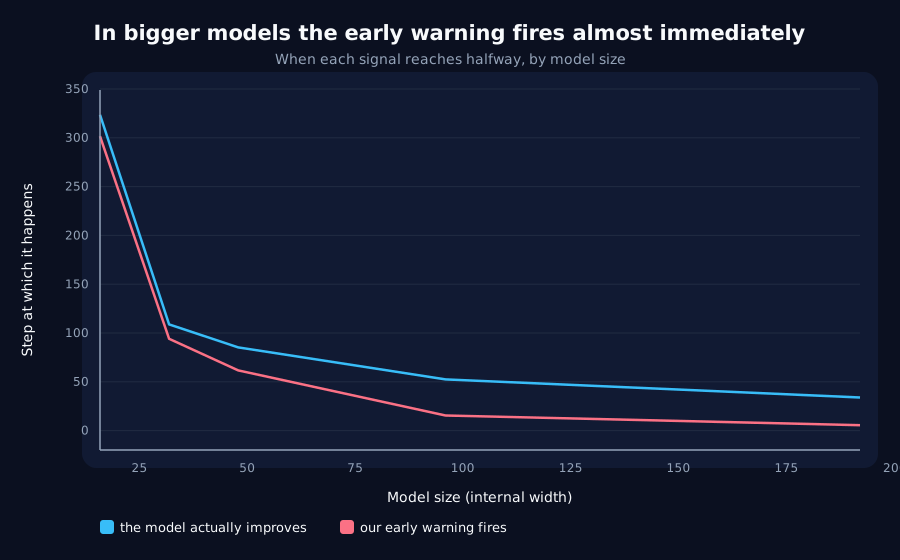
Why it matters. The reason is the interesting part, and it is bad news for us. In bigger models the warning fires earlier and earlier: in the largest, it goes off at step five of a thirty-four step run. It has not become unreliable, it has become uninformative, because it now says the improvement is coming sometime in almost the entire remaining run. The cause is something we found earlier: an untrained network is already a decent feature extractor, and a bigger untrained network is a much better one, so there is less and less for training to add before the answer becomes readable. Everything we study here is deliberately tiny, and this is the first result suggesting one of our central tools points the wrong way when that changes.
The rest of this page is the technical record: the design, every number, and the limits. It is written for a reviewer, and you do not need it to have understood the result above.
New here? How to read a research record
- Start at the verdict. Every record states, before the experiment was run, what result would have made us abandon the idea. That is the "kill test". Then it says whether the test fired. Nothing gets reinterpreted after the fact.
- Numbers in square brackets are uncertainty.
23.4 [18.1, 28.7]means our best estimate is 23.4 and the true value is probably somewhere in that range. If a range includes zero, we cannot claim an effect. - Results that rule an idea out are kept. Roughly half of what is published here says an approach did not work, including plenty of our own. Those pages are the output, not a shortfall: knowing which direction is a dead end is what lets the next experiment go somewhere better, and most of what we now rely on came out of understanding why something else fell short. Work that only publishes what worked is not measuring anything.
- Read the Limits section. Every record ends with what it does not show. It is the most honest part of any experiment and usually the shortest.
- Pro tip: the figures near the top are designed to carry the result on their own. If you read nothing else, read the caption under each one, which says what it shows and what to take from it.
EXPLORATORY. Not a preregistered study. Local CPU, 25 training runs, no GPU, no cost.
Program v2 Bucket J, item J5. Decisive computation: analysis/lead_width_scaling.pyanalysis/lead_width_scaling.jsonpython analysis/lead_width_scaling.py, or re-decide the crossing level with --reuse.
The question
I2 found the decode probe's lead is 0.24-0.28 of the time to the transition across a 3.2x change in training length, and concluded that F2's published +23.5 steps should be quoted as a share of the run rather than a step count.
But I2 varied training length, at one width. A fraction that survives a change of learning rate is a fact about that model. A fraction that also survives a change of size would be the first thing in this programme that transfers to a model nobody has run.
Kill test: the fraction varies with width beyond seed noise.
Result: the kill test fails, and it fails hard
| Width | Transition | Probe crosses at | Lead in steps | Lead as a fraction |
|---|---|---|---|---|
| 16 | 323.5 | 301.6 | +21.9 [+14.6, +29.3] | 0.067 [0.049, 0.085] |
| 32 | 108.8 | 94.0 | +14.8 [+13.0, +16.6] | 0.137 [0.113, 0.160] |
| 48 | 85.2 | 61.6 | +23.5 [+20.5, +26.6] | 0.276 [0.252, 0.300] |
| 96 | 52.5 | 15.5 | +37.0 [+34.7, +39.3] | 0.705 [0.674, 0.736] |
| 192 | 33.9 | 5.5 | +28.4 [+27.2, +29.6] | 0.837 [0.819, 0.855] |
The fraction varies by 76.6% across widths. The step count varies by 29.3%. Seed noise within a width is 8.5%.
So neither description is constant, but the step count is the stabler of the two, which is the opposite of what I2 concluded. The fraction rises monotonically and enormously with width, with non-overlapping intervals at every step.
Width 48 reproduces I2 exactly at 0.276, so this is not a different measurement disagreeing. It is the same measurement at four more sizes.
It is width, not training length
The obvious objection is that the learning rate was held fixed, so wider models transition sooner (323 steps at width 16 against 34 at width 192) and width is confounded with training length. The data separates them:
| Transition | Fraction | |
|---|---|---|
| width 16, this pilot | 323.5 | 0.067 |
width 48, I2 at lr 0.001 | ~270 | 0.240 |
Similar training length, 3.6x different fraction. Length is not what moves it.
The mechanism is F3's reservoir effect, scaling
Look at the third column. The probe's own crossing collapses from step 301.6 to step 5.5 as width grows 12x. The lead in steps wanders (+21.9, +14.8, +23.5, +37.0, +28.4) with no trend at all; the fraction rises only because its denominator is shrinking and the probe crossing is racing toward zero.
That is F3's finding scaling with size: a randomly initialised recurrent network is already a useful feature extractor, and a wider one is a much better one. At width 192 an optimally fitted linear readout reaches 50% accuracy at step 5.5 of a 34-step transition. The answer is very nearly decodable from an untrained network.
The probe's instrument check passes 5/5 at every width, so none of this is an under-powered or over-powered probe. That check exists because F2's first version returned the opposite verdict from a weak probe, and it is run per width because a probe validated at width 48 says nothing about 192.
Verdict
- The kill test fails. The lead-as-a-fraction is a width-48 fact, not a law.
- I2's reframing is correct within a width and does not generalise across sizes. A correction banner is appended to that record.
- Neither unit is safe to quote alone. Steps vary
29.3%, the fraction76.6%, both above the8.5%seed noise. Quote the width. - The instrument degrades with scale, and not in the way anyone expected. It does not get noisier; it fires earlier and earlier until it carries almost no timing information. At width 192, "the probe crossed" happens at step
5.5and tells you the transition is somewhere in the next28steps, which is most of the run. This is a real limit on the programme's only positive instrument, and it points the wrong way for scaling up.
Limits
- Five seeds per width, five widths, one task, one learning rate, one crossing level. The intervals are tight and non-overlapping, so the trend is not marginal, but the sample is small in absolute terms.
- The learning rate is fixed across widths by design. Screening per width would confound size with whatever the screen optimised for; holding it fixed confounds size with training length. The comparison against I2 above is what separates them, and it rests on a single cross-record pairing.
- Width 16 is close to failing to learn (
323steps of a900-step budget), so its numbers sit nearest the edge of the usable range. - This measures the probe's crossing, not the transition's cause. Nothing here says why a wider reservoir decodes sooner, only that it does.
Terms on this page
Every piece of vocabulary this record uses, in plain language. Generated from the text above, so it cannot drift out of step with it.
- accuracy
- The fraction of answers a model gets right on questions it was not trained on.
- confound
- A second explanation you did not control for. If bigger models both learn faster and score higher, then 'fast learners score higher' may be entirely about size and not about speed.
- kill test
- A condition written down before running the experiment that says what result would make us abandon the idea. Fixing it in advance is what stops a disappointing result being reinterpreted as an encouraging one.
- learning rate
- How big a step training takes each time it updates the model. Too small and nothing happens; too big and it never settles.
- probe
- A small separate model trained to read information out of a bigger model's internals, used as a measuring instrument rather than as a product.
- recurrent
- A design that reads a sequence one item at a time, carrying memory forward. The main alternative is attention, which looks at everything at once.
- seed
- The number that fixes all the randomness in a training run. Same seed, same run. Running several seeds is how you tell a real effect from a lucky one.
- width
- How many internal numbers a model uses at each layer. The usual way we vary model size in these experiments.
Get new results as we publish them
Roughly monthly, one finding per email, in plain English first. Including the approaches that turned out not to work, which are usually the useful ones. No sales email.
Double opt-in: we send a confirmation link and add nobody who does not click it. One-click unsubscribe on every email.