
When Your Metric Moves With What It Measures
We run a separate research programme studying how models learn, using models small enough that every experiment can be rerun on a laptop in minutes. It exists so that the claims we make elsewhere on this site rest on a process we can show you, not just on results we assert.
This is the story of a measurement in that programme that was wrong for a year, in a way that looked completely convincing.
A model does not learn gradually
Train a small model on a task where it has to remember a token it saw a few steps ago, and it does nothing for a while. It sits at chance. Then, over a few dozen steps, it learns the task almost completely.
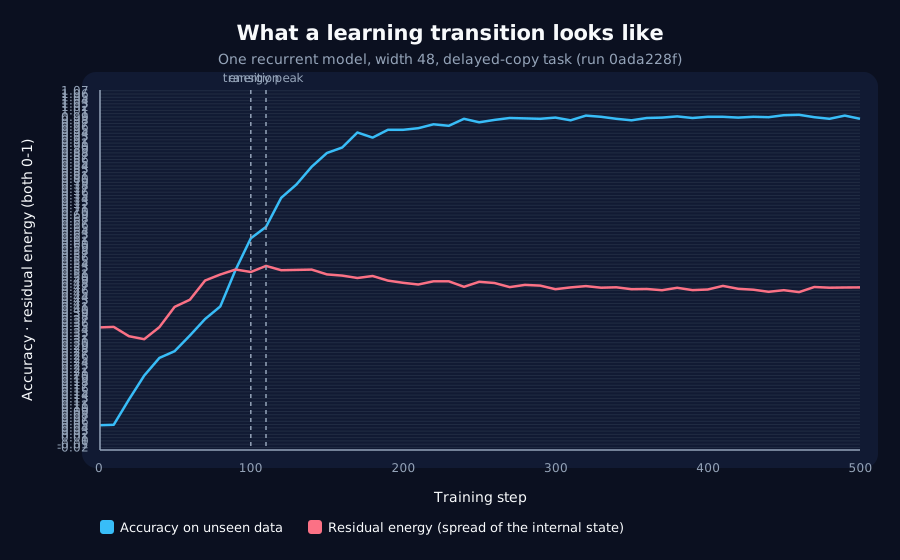
The interesting part is the orange line. It measures how much of the model's internal activity lies outside the handful of directions it relies on most. Low means the internal state is compact and organised. High means it is spread out.
That line does something specific: it rises sharply as the model learns, peaks, and then settles back down. We had a name for the settling part. We called it consolidation, and we treated it as the model tidying up after itself: a burst of internal reorganisation, then a return to order.
The settling was not real
Here is the problem. That measurement is taken relative to whichever directions the model is currently relying on most. Those directions are recalculated every time we measure. So the number is not "how spread out is the state", it is "how spread out is the state, relative to where the state currently is".
So we measured it again with the directions fixed. Pick them once, before the jump, and never move them. Same runs, same data, same forty-one experiments.
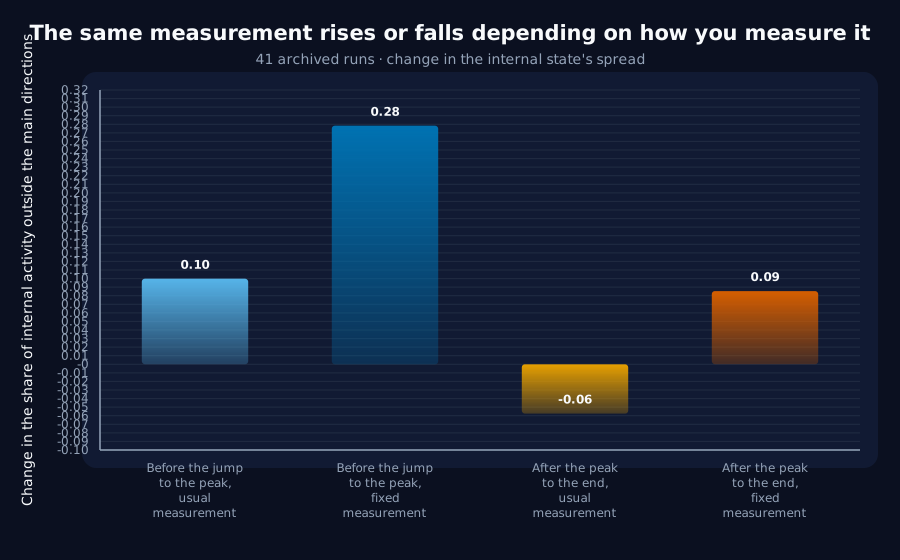
Before the jump, both measurements agree that the spread increases. The fixed one actually sees nearly three times more of it, which means the usual measurement had been understating a real effect.
After the peak, they disagree completely. The usual measurement falls, from 0.4808 to 0.4233, in 41 runs out of 41. The fixed measurement rises, from 0.4808 to 0.5662, in 40 runs out of 41.
Both statements are true of the same runs. Nothing contracts. The energy in those directions keeps growing after the peak, by a factor of 2.18. What changes is which directions get counted as the important ones. The model's main directions rotate to catch up with where the activity already is, and our number falls because the ruler moved, not because anything shrank.
In plain English
Imagine measuring a child's height every month against a mark on the wall, except the wall is on a platform that quietly rises as the child grows. Early on the child grows faster than the platform, so you record growth. Later the platform catches up, and your tape measure says the child is shrinking.
The child never shrank. We had been reporting the platform.
What it cost us, and what it saved
We had a planned experiment that would have used this settling as a signal for when to stop training. That experiment is now cancelled. It would have been triggering on a property of our measuring stick, and if it had appeared to work we would have had a stopping rule with no mechanism behind it.
The finding that survives is stronger than the one we had. The rise before the jump is real, and it is 2.8 times larger than we had been reporting.
Why this belongs on a vendor's website
Because the same failure is common in AI evaluation, and it is easy to buy.
A metric that is computed relative to the model's own current state will move when the model moves, and it will look stable exactly when the model is changing underneath it. If a vendor tells you a system's confidence, drift, or internal quality score has settled, the useful question is what that number is measured against, and whether that reference point is allowed to move. If it is, "settled" may mean the reference caught up rather than the system stabilised.
Our own rule now, written into the programme's decision log: any quantity compared across time has to state its reference frame, or it does not get reported. We adopted that rule because we needed it, not because it sounded rigorous.
Read the full record, including the code that produces every number
Every figure above is generated directly from the recorded data by a script, not drawn by hand. We publish the results and the data behind them here, including the ones that went against what we expected.
Get new results as we publish them
Roughly monthly, one finding per email, in plain English first. Including the approaches that turned out not to work, which are usually the useful ones. No sales email.
Double opt-in: we send a confirmation link and add nobody who does not click it. One-click unsubscribe on every email.