
Fourteen Versions of One Number
We run a research programme on how models learn, deliberately using models small enough that anyone can rerun the experiments on a laptop. It exists so the numbers we quote elsewhere on this site rest on a process we can show you.
A few days ago three of its results were damaged in a single afternoon, all by the same kind of mistake: a measurement defined relative to the thing it was measuring. That raised an obvious question we had never asked. How much of our published work rests on a measurement like that?
Looking for the answer turned up something we were not expecting, and it is the part most likely to be true of your organisation too.
The thing we found first
The measurement in question answers a simple question: at what point during training did this model suddenly get good? These models do not improve smoothly. They plateau, then jump. A great deal of what we study depends on pinning down when that jump happened.
We searched our own code for every function that answers that question.
There were fourteen of them. Fourteen separate implementations of the same idea, spread across forty-one experiments, differing in four ways that nobody ever sat down and decided:
- where the run's starting point is taken from, its lowest score or the average of its first few
- where its finishing point is taken from, its highest score or the average of its last few
- whether runs that barely improved are excluded, and at what cutoff: none, fifteen per cent, or thirty
- whether the answer is the first checkpoint past the halfway mark, or an interpolated point between two checkpoints
None of these are wrong. Each was a reasonable choice made once, copied, and then adjusted slightly by whoever needed it next. This is what duplication looks like when the duplicated thing is a definition rather than a function: it breaks nothing, it just quietly means two experiments claiming the same thing were not measuring the same thing.
So we made all fourteen answer the same questions, on the same 1,091 saved training runs.
Question one: do they agree?
Mostly, yes, which was a relief. On identical runs they place the moment within about four training steps of each other, less than one per cent of a run.
Then we asked the harder version. A measurement that describes a moment should not care what happened afterwards. So we threw away the last fifth of every run and asked again, keeping only runs where the moment was comfortably inside what remained.
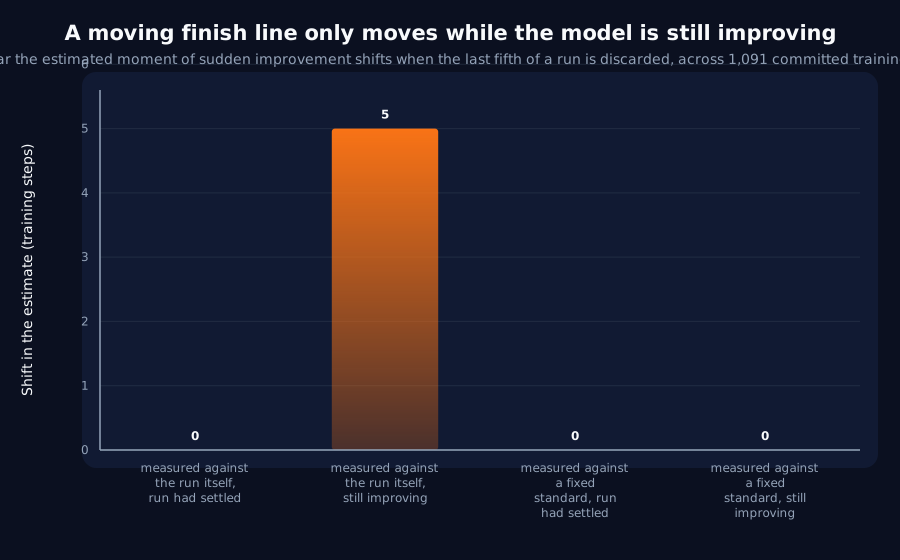
The drift is real, small, and confined entirely to runs that had not finished improving. On runs that had settled, nothing moves. On runs still getting better when we stopped looking, the answer shifts by one measurement interval, which is the smallest amount we can detect.
That is a usable result rather than a worrying one, because the condition is checkable. Had this run stopped improving by the time you stopped watching? If yes, the measurement is safe. If no, it is drifting, and you can say roughly how much.
One of the fourteen never drifts at all: the one that compares against a fixed standard set by the task rather than against the run itself. Hold that thought.
Question two: what about the other measurement?
There is a second number in this programme, for how abrupt the jump was rather than when it happened. It underpins the only results we have about how these effects scale with model size. It has three implementations, and the most-used one divides by two things: how long the run was, and how many times we checked the model along the way.
Neither of those is a fact about the model. Both are choices in the logging code.
Before measuring anything we wrote down what the arithmetic predicted: throwing away a fifth of a run should reduce this number by exactly twenty per cent, purely from the division, with no reference to what the model did. Observed: 19.7%.
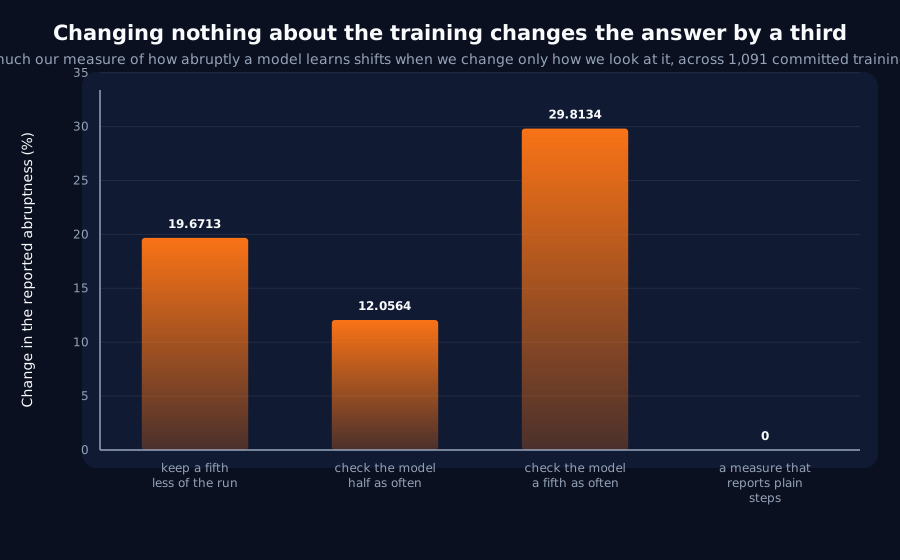
The second axis was worse, and nobody had looked at it. Checking the model a fifth as often moves the number by thirty per cent, which happens to be exactly the difference between two of our own experiments that share this measure.
We want to be precise about what this did and did not damage. It damaged nothing. Every comparison in our archive turned out to happen between runs measured the same way, because an earlier result had already spotted the hazard and written down a rule against crossing it. The rule was obeyed. What was missing was any sense of what it was worth. Thirty per cent, as it turns out.
Question three: does any of it change an answer?
Agreeing on a number is not the same as agreeing on an answer. Our answers are usually of the form "did this change make the model learn sooner than that one", and that comes down to whether two ranges overlap. Near that line, a small shift decides everything.
So we took every comparison in the archive, two hundred of them, and recomputed each one all fourteen ways.
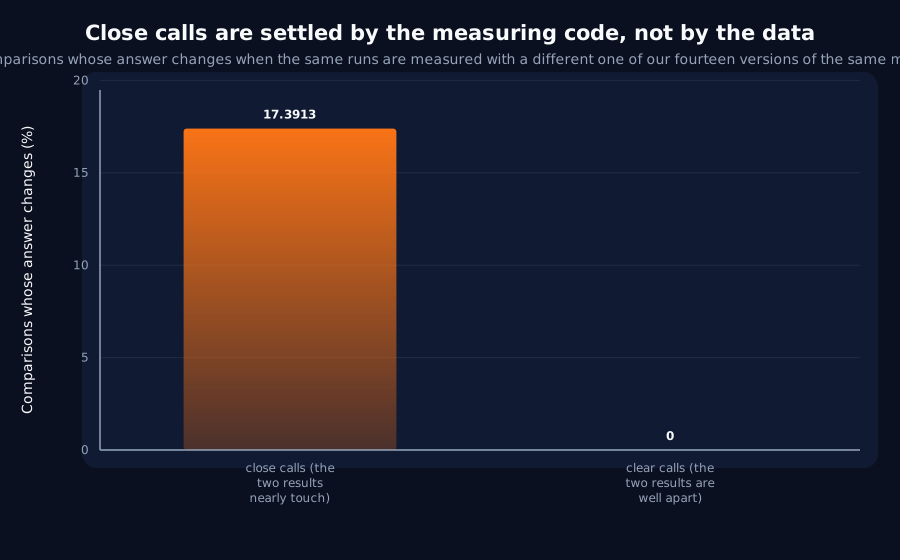
Seven changed their answer. The pattern behind them is clean enough to be a rule:
- among comparisons where the two groups nearly touch, about one in six changes its answer depending on which version you use
- among comparisons where the two groups are clearly apart, none does
So: if two results are separated by less than one measurement interval, the code is deciding the answer rather than the models are, and we now report those as undecided.
Two things we did not expect
Eleven of the fourteen versions cannot measure a warm-started model at all. They contain a sensible safety check that ignores runs which did not improve much, because a flat noisy line has a highest and a lowest point and will happily produce a confident-looking answer from nothing. But a model started from an already-trained one does not improve much, by definition. The check that protects against reading meaning into a flat line also silently throws out exactly the experiments whose entire point is starting well.
An exclusion rule is not a safety feature. It is a decision about which runs are in your average, and it can be systematically biased against the thing you are trying to demonstrate.
And the version that never drifts is not a drop-in replacement. The one measured against a fixed task standard, the hero of the first check, turns out to answer a different question. For a model too small to reach that standard it reports a moment nearly three times later than every other version. Both answers are correct. "When did this run do most of its own learning" and "when did this run reach the bar the task sets" are simply different questions, and for an undersized model they diverge hugely.
Being stable and being interchangeable are different properties. We had quietly assumed one implied the other.
What we would suggest to anyone measuring anything
- Count your definitions. Not your metrics, your implementations of them. We assumed we had one and we had fourteen. The check took an afternoon and now runs automatically, refusing to proceed if a fifteenth appears.
- Prefer a measurement in real units. The versions that report plain training steps were immune to everything we threw at them. The ones that divide by properties of the run were not.
- Quote the margin, not just the verdict. "These two differ" is much less useful than "these two differ by three times the smallest amount we can detect".
- Predict the size of an artefact before you measure it. Our twenty per cent prediction cost one line of algebra and turned a measurement into a test. Observing 19.7% then meant "this is purely the division", rather than merely "it moved".
None of this makes our models less small or our task less synthetic; those limits are on every page and have not changed. What we can say is that when we went looking for a systemic problem, we found a real one that was smaller than feared, a second one nobody had looked for, and a rule that tells us which of our own answers to stop trusting.
The full record, with all fourteen definitions and every number
Get new results as we publish them
Roughly monthly, one finding per email, in plain English first. Including the approaches that turned out not to work, which are usually the useful ones. No sales email.
Double opt-in: we send a confirmation link and add nobody who does not click it. One-click unsubscribe on every email.