
A Speed-Accuracy Frontier
Ongoing research. This is an experimental result from active work, not a settled conclusion. The numbers are what we measured and the method is described so you can judge it, but the programme is still running and later experiments may revise what it means.
A note on the language in these records. This is a working laboratory notebook for research into training AI models more cheaply and efficiently, so you will read that an approach did not work, that a result did not hold up, or that one method was worse than another. That is the research doing its job, not a verdict on the engineering we deliver to clients. Ruling an approach out is how the search narrows, and these are the pages that teach us the most: nearly every technique we now rely on came from understanding why something else fell short. Testing our own ideas at least as hard as anyone else's is the point of publishing them. More about this programme and why we run it.
Part of a bigger question: What actually makes training cheaper? – One thing has worked: stopping part of the training early saved about 7% with no loss of quality. Everything else tested has been matched by a simpler or cheaper method -- and in two cases the clever method was only winning because it was quietly being given more.
In plain English
What we asked. Our last result showed the learning speed used in some of our experiments had never been tuned. So we tuned it: we tried six settings and recorded both how soon the models learned and how accurate they ended up.
What we found. Faster settings always learned sooner, but past a point they ended up less accurate. The fastest setting that kept full accuracy learned in half the time of the old one. At that setting, one of the tricks we had found earlier stopped helping and started to slow learning down. A second trick, a short burst of faster learning, still helped, but it only matched what a slightly faster setting does.
Why it matters. Every speed-up should be measured against a properly tuned baseline. Measured against an untuned one, a trick can look useful simply because it partly fixes the bad setting.
The rest of this page is the technical record: the design, every number, and the limits. It is written for a reviewer, and you do not need it to have understood the result above.
New here? How to read a research record
- Start at the verdict. Every record states, before the experiment was run, what result would have made us abandon the idea. That is the "kill test". Then it says whether the test fired. Nothing gets reinterpreted after the fact.
- Numbers in square brackets are uncertainty.
23.4 [18.1, 28.7]means our best estimate is 23.4 and the true value is probably somewhere in that range. If a range includes zero, we cannot claim an effect. - Results that rule an idea out are kept. Roughly half of what is published here says an approach did not work, including plenty of our own. Those pages are the output, not a shortfall: knowing which direction is a dead end is what lets the next experiment go somewhere better, and most of what we now rely on came out of understanding why something else fell short. Work that only publishes what worked is not measuring anything.
- Read the Limits section. Every record ends with what it does not show. It is the most honest part of any experiment and usually the shortest.
- Pro tip: the figures near the top are designed to carry the result on their own. If you read nothing else, read the caption under each one, which says what it shows and what to take from it.
EXPLORATORY. Not a preregistered study. Local CPU, 72 training runs. The design, tuning rule and kill test were committed (7b2fdd1) before any run.
Program v2 Bucket O, item O16. Decisive computation: analysis/tuned_rate_speedups.pyanalysis/tuned_rate_speedups.jsonpython analysis/tuned_rate_speedups.py (about twenty-five minutes on a throttled laptop CPU); --reuse re-derives every endpoint from the saved runs, and was checked to print the identical summary.
The question
O15 found J8's substrate (width-48 GRU, delayed copy, lag 4) reaches its transition 38% sooner at 0.004 than at J8's 0.002, with the optimum not reached. Where is the optimum, and do the substrate's two cleanest speed-ups survive there?
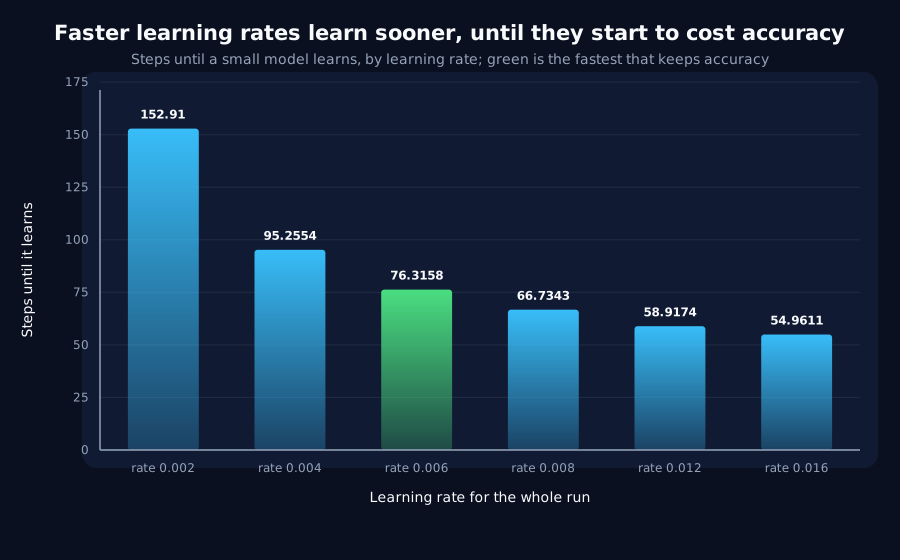
Part A sweeps whole-run rates on J8's eight receivers, recording the transition, the final held-out accuracy (step 460) and gate losses. The tuned rate, fixed before execution, is the fastest rate whose runs all pass the gate and whose mean final accuracy is within 0.01 of the 0.002 control's.
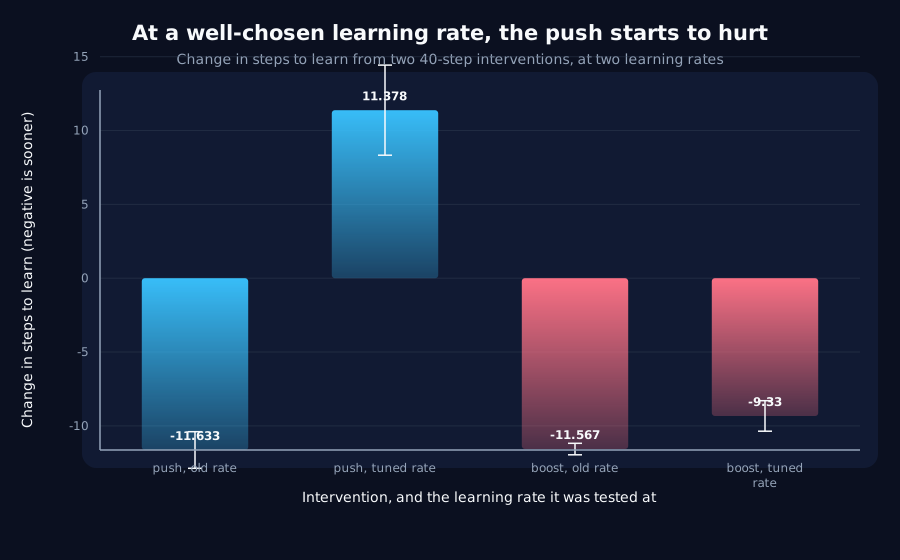
Part B re-runs, at the tuned rate, O14's two speed-ups in their offline, no-look-ahead form: the mean-gradient push and the 1.5x learning-rate boost, both for 40 steps at one fixed opening step (the tuned controls' mean transition minus 40, rounded).
Kill test, fixed before execution: at the tuned rate both speed-ups have intervals including zero.
Anchor, in code: the 0.002 controls equal J8's committed transitions exactly. They do.
Part A: the tuned rate is 0.006
| Whole-run rate | Mean transition (steps) | Final accuracy | Runs lost to the gate |
|---|---|---|---|
0.002 (J8) | 152.9 | 0.9817 | 0 |
0.004 | 95.3 | 0.9846 | 0 |
0.006 | 76.3 | 0.9793 | 0 |
0.008 | 66.7 | 0.9703 | 0 |
0.012 | 58.9 | 0.9507 | 0 |
0.016 | 55.0 | 0.9198 | 0 |
Faster rates keep reaching the transition sooner -- 0.016 in 55 steps, a third of J8's time -- but they end worse: 0.008 is 0.011 below the control's final accuracy, just outside the margin, and 0.016 is 0.062 below. The tuning rule picks 0.006: half J8's time to transition at the same final accuracy. There is a speed-accuracy frontier here, and J8's rate sat far behind it.
Part B: the push reverses; the boost survives
At 0.006, window opening at step 36, eight receivers:
| Speed-up | Change in the transition |
|---|---|
| mean-gradient push | +11.38 [+8.33, +14.43] -- now a delay |
1.5x learning-rate boost | -9.33 [-10.36, -8.30] |
The kill test does not fire, because the boost still helps. But read the two rows together:
- The push reverses sign. At
0.002it removed11.75steps (O14); at the tuned rate it adds11.38. Its window now opens at step36, and its direction averages the32gradients of steps4-35-- the model's first, noisiest moves. O14 already found that pushing early hurts; at the tuned rate, early is the only place the window can go. - The boost is still a learning-rate change. Raising
0.006by half for forty steps lands the transition at about67-- where a whole-run0.008lands (66.7). Whether the boost keeps the final accuracy that a whole-run0.008loses is the one thing that would make it worth having, and this pilot did not record final accuracy for the boosted runs. That is O18.
What stands
- J8's substrate has a speed-accuracy frontier, and at matched final accuracy its tuned rate (
0.006) halves J8's time to the transition (152.9to76.3). - The mean-gradient push does not survive tuning: it becomes a delay (
+11.38). - A short
1.5xboost still speeds the transition at the tuned rate (-9.33), matching a whole-run rate one step up the ladder; its effect on final accuracy is unmeasured. - The house rate
0.005that most of this programme uses sits close to this substrate's tuned rate -- about8.5steps of time to transition apart by interpolation, as R18 reports -- while J8's0.002sat about77steps away.
Limits
- Final accuracy was recorded for the sweep, not for Part B's arms. The boost's cost is O18.
- The tuning margin (
0.01) is a choice, fixed in advance;0.008misses it by0.0014. - One substrate, eight receivers,
460steps: a longer run could change the accuracy ranking.
Terms on this page
Every piece of vocabulary this record uses, in plain language. Generated from the text above, so it cannot drift out of step with it.
- accuracy
- The fraction of answers a model gets right on questions it was not trained on.
- gradient
- The direction and amount by which each of a model's internal numbers should change to do slightly better. Training is repeatedly following it.
- GRU
- Gated Recurrent Unit. A compact design for processing sequences one item at a time, with internal switches controlling what it keeps in memory.
- held-out
- Data the model was never trained on, kept back specifically to test it. Scoring a model on data it has already seen measures memorisation, not learning.
- interpolation
- Estimating a value between two measured points by drawing a straight line between them. It gives a finer answer than the measurements themselves, at the cost of assuming what happened in between.
- kill test
- A condition written down before running the experiment that says what result would make us abandon the idea. Fixing it in advance is what stops a disappointing result being reinterpreted as an encouraging one.
- learning rate
- How big a step training takes each time it updates the model. Too small and nothing happens; too big and it never settles.
- width
- How many internal numbers a model uses at each layer. The usual way we vary model size in these experiments.
Get new results as we publish them
Roughly monthly, one finding per email, in plain English first. Including the approaches that turned out not to work, which are usually the useful ones. No sales email.
Double opt-in: we send a confirmation link and add nobody who does not click it. One-click unsubscribe on every email.