
Six Numbers
Ongoing research. This is an experimental result from active work, not a settled conclusion. The numbers are what we measured and the method is described so you can judge it, but the programme is still running and later experiments may revise what it means.
A note on the language in these records. This is a working laboratory notebook for research into training AI models more cheaply and efficiently, so you will read that an approach did not work, that a result did not hold up, or that one method was worse than another. That is the research doing its job, not a verdict on the engineering we deliver to clients. Ruling an approach out is how the search narrows, and these are the pages that teach us the most: nearly every technique we now rely on came from understanding why something else fell short. Testing our own ideas at least as hard as anyone else's is the point of publishing them. More about this programme and why we run it.
Part of a bigger question: Which parts of a model actually matter? – The parts that move most are not the parts that matter, and no single component is required -- the model routes around every freeze. What a part is worth shows up only when you remove it.
In plain English
What we asked. When a trained model hands its internal machinery to a fresh one, the fresh model learns much faster. Buried in that machinery are 288 small offset numbers, under two per cent of the model, and a previous result found they carry about a third of the whole benefit. That is a striking amount of value in very few numbers, so we asked whether you need the numbers themselves or just a description of them.
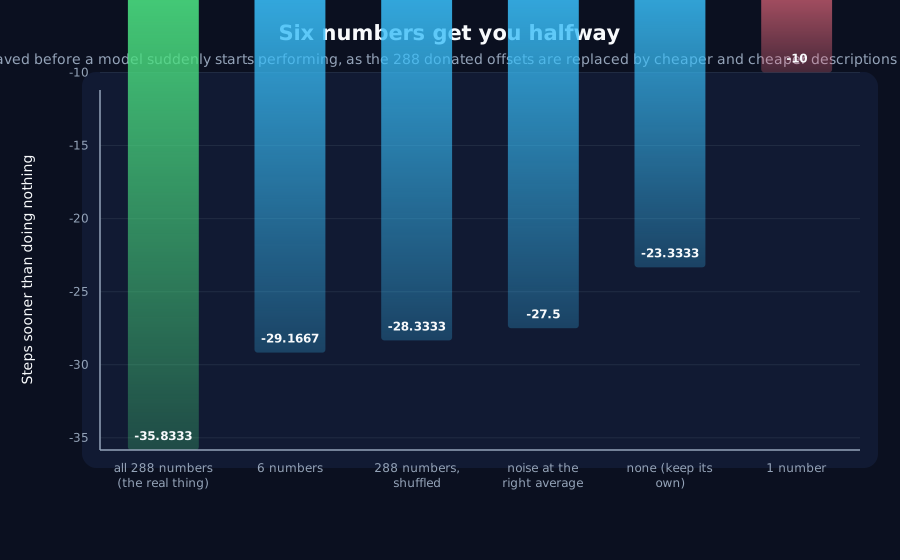
What we found. Mostly a description will do. Replacing all 288 with six averages, one for each kind of internal gate, recovers about half of what the real numbers were worth. Shuffling the real numbers so none is in its original place works just as well, and so does throwing them away entirely and using random noise centred on the right averages. So the individual values carry almost nothing. There is one sharp exception: collapsing everything to a single average for the whole model is worse than handing over nothing at all, because different gates want different offsets and averaging across them cancels the useful part out.
Why it matters. This narrows a conclusion we published two days earlier. That record said the benefit could not be reduced to a summary and therefore could not be manufactured. It was right about the bulk of the machinery, but wrong about this part, and wrong for an instructive reason: it had tested these offsets on their own, in a setting where a companion result later showed they cannot possibly do anything. The test was guaranteed to find nothing before it was run. We have narrowed the earlier claim rather than withdrawn it, because it still holds for everything else. The general lesson is that a null result is only as good as the conditions it was measured in, and the way to find that out is to keep following up your own conclusions instead of filing them.
The rest of this page is the technical record: the design, every number, and the limits. It is written for a reviewer, and you do not need it to have understood the result above.
New here? How to read a research record
- Start at the verdict. Every record states, before the experiment was run, what result would have made us abandon the idea. That is the "kill test". Then it says whether the test fired. Nothing gets reinterpreted after the fact.
- Numbers in square brackets are uncertainty.
23.4 [18.1, 28.7]means our best estimate is 23.4 and the true value is probably somewhere in that range. If a range includes zero, we cannot claim an effect. - Results that rule an idea out are kept. Roughly half of what is published here says an approach did not work, including plenty of our own. Those pages are the output, not a shortfall: knowing which direction is a dead end is what lets the next experiment go somewhere better, and most of what we now rely on came out of understanding why something else fell short. Work that only publishes what worked is not measuring anything.
- Read the Limits section. Every record ends with what it does not show. It is the most honest part of any experiment and usually the shortest.
- Pro tip: the figures near the top are designed to carry the result on their own. If you read nothing else, read the caption under each one, which says what it shows and what to take from it.
EXPLORATORY. Not a preregistered study. Local CPU, 6 receivers across 6 arms, no GPU, no cost.
Program v2 Bucket P, item P7, generated by P6. Decisive computation: analysis/synthetic_bias.pyanalysis/synthetic_bias.jsonpython analysis/synthetic_bias.py; --reuse re-derives every endpoint.
The question, and why P5's answer did not settle it
P1 found a donor's converged recurrent weights remove 35.8 steps from a receiver's time to transition. P5 concluded the head start is not capturable as a summary statistic and therefore not manufacturable. P6 then found the gate biases carry 12.5 of those 35.8 steps, about a third, from 288 of 17,280 parameters, and that they contribute only alongside the donor's weights.
That last point is what reopens the question. P5 tested biases alone, on a random initialisation, which is precisely the condition P6 showed produces a null by construction. P5's bias result was guaranteed by its own design and says nothing about whether the bias contribution can be synthesised where it actually operates.
Kill test, fixed before execution: no synthesised bias arm has an interval overlapping P1's -35.8 [-42.0, -29.7].
Anchors enforced in code: P1's transplant arm (-35.8) and P6's weights arm (-23.3), which together bracket the 12.5 steps every other arm is trying to recover. The script exits 2 otherwise. Both pass.
What we found
Every arm sits on top of the donor's converged recurrent weights; only the 288 bias numbers differ. receiver-biases at -23.3 is the floor and donor-biases at -35.8 is the ceiling.
| Bias vector | Numbers it takes from the donor | Effect |
|---|---|---|
donor-biases (ceiling, P1) | 288 | -35.8 [-42.0, -29.7] |
per-gate-mean | 6 | -29.2 [-33.1, -25.2] |
shuffled (donor's values, unit assignment destroyed) | 288, unassigned | -28.3 [-32.6, -24.0] |
matched-noise (Gaussian at the donor's mean and spread) | 12 | -27.5 [-31.9, -23.1] |
receiver-biases (floor, P6) | 0 | -23.3 [-27.6, -19.0] |
scalar (one number, gates ignored) | 1 | -10.0 [-26.3, +6.3] |
The kill test does not fire. Three arms have intervals overlapping P1's.
But read the point estimates, not only the overlap. The best synthesised arm reaches -29.2 against the donor's -35.8, from a floor of -23.3. That recovers 5.9 of the 12.5 steps, about 47%: roughly half the bias contribution, and about a sixth of the whole head start. The overlap with P1's interval is real but marginal, and no synthesised arm's point estimate falls inside it. Stated plainly: about half of the bias third is manufacturable, and half is not.
Three things the ladder separates cleanly
The specific 288 numbers carry almost nothing. shuffled destroys the assignment of bias values to units and loses 0.9 steps against per-gate-mean, well inside noise. matched-noise throws the values away entirely and keeps Gaussian noise at the donor's per-gate mean and spread, and loses 1.7. What the biases contribute is not which unit gets which offset.
The mean is doing the work, not the spread. per-gate-mean sets every unit in a gate to that gate's mean, zero variance, and scores slightly better than matched-noise, which reproduces the donor's variance too. Six numbers beat twelve.
But the gates are not interchangeable. scalar collapses to one number across all gates and falls to -10.0, which is worse than giving the receiver its own biases back, with an interval spanning +6.3. A GRU's update and reset gates want different offsets, and averaging across them is actively harmful.
What this does to P5's conclusion
P5's headline, the head start is not capturable as a summary statistic: needs narrowing, not withdrawing. It is right about the weight matrices, where P5 and P6 together tested magnitudes, directions and four statistics and found nothing. It is wrong as stated about the biases, because its bias arm was run in the one context where the effect cannot appear.
The corrected joint reading across P1, P5, P6 and P7:
A donor's converged recurrent weights transfer about two thirds of the head start and are irreducible: no statistic, no factor, no summary reproduces them. The donor's biases transfer the other third, and about half of that is a recipe: one mean per gate, six numbers, no donor needed beyond knowing what those means should be.
What it does not show
This is still not an efficiency claim. The six numbers came from a donor that trained for 400 steps. It becomes a saving only if those per-gate means can be predicted without one, from the task, from the architecture, or from a much shorter run. That is the obvious next item and is filed as P8.
Limits
- The transition endpoint is quantised to 5 steps. The gaps between the three synthesised arms are
0.9and1.7steps and should not be ranked against each other; only their common separation from the floor and the ceiling is read here. scalarhas a wide interval ([-26.3, +6.3]) spanning zero, so "worse than the floor" is the honest reading rather than any particular value.- Six receivers, one width, one task, one graft point, one donor each.
- The synthesised biases still sit on top of the donor's weights, which are not synthesised. The recipe is for one third of the effect, not for the effect.
Terms on this page
Every piece of vocabulary this record uses, in plain language. Generated from the text above, so it cannot drift out of step with it.
- architecture
- The blueprint of a model: what components it has and how they connect. Two models can be the same size and completely different architectures.
- GRU
- Gated Recurrent Unit. A compact design for processing sequences one item at a time, with internal switches controlling what it keeps in memory.
- kill test
- A condition written down before running the experiment that says what result would make us abandon the idea. Fixing it in advance is what stops a disappointing result being reinterpreted as an encouraging one.
- parameters
- The adjustable numbers inside a model. Training is the process of setting them. Model size is usually quoted as a count of these.
- recurrent
- A design that reads a sequence one item at a time, carrying memory forward. The main alternative is attention, which looks at everything at once.
- variance
- How spread out a set of numbers is. Rising variance in a signal means it is becoming more erratic.
- width
- How many internal numbers a model uses at each layer. The usual way we vary model size in these experiments.
Get new results as we publish them
Roughly monthly, one finding per email, in plain English first. Including the approaches that turned out not to work, which are usually the useful ones. No sales email.
Double opt-in: we send a confirmation link and add nobody who does not click it. One-click unsubscribe on every email.