
The Number Survives, The Advice Does Not
Ongoing research. This is an experimental result from active work, not a settled conclusion. The numbers are what we measured and the method is described so you can judge it, but the programme is still running and later experiments may revise what it means.
A note on the language in these records. This is a working laboratory notebook for research into training AI models more cheaply and efficiently, so you will read that an approach did not work, that a result did not hold up, or that one method was worse than another. That is the research doing its job, not a verdict on the engineering we deliver to clients. Ruling an approach out is how the search narrows, and these are the pages that teach us the most: nearly every technique we now rely on came from understanding why something else fell short. Testing our own ideas at least as hard as anyone else's is the point of publishing them. More about this programme and why we run it.
Part of a bigger question: What actually makes training cheaper? – One thing has worked: stopping part of the training early saved about 7% with no loss of quality. Everything else tested has been matched by a simpler or cheaper method -- and in two cases the clever method was only winning because it was quietly being given more.
In plain English
What we asked. We recently counted how many of our own findings have ever been checked on more than one kind of task, and the answer was four out of forty-three. This is the first of the unchecked ones we went back and tested, and we picked it because more of our other work depends on it than on any of the others: it is our only estimate of when reusing a trained model actually pays for itself.
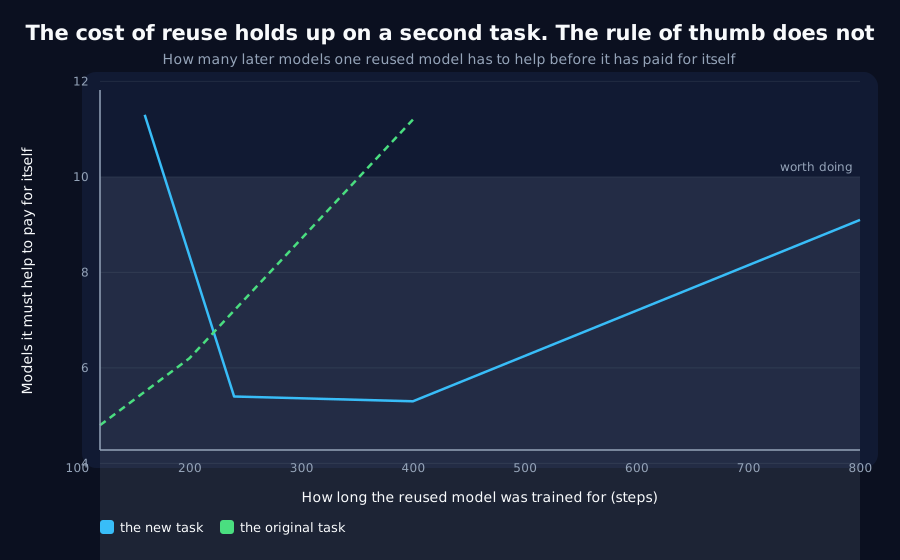
What we found. The estimate held up. On the original task a reused model had to help about five later ones before it was worth the cost of making it. On a task it had never been tested on, the answer is also about five. That is reassuring and it is the first of the nineteen to survive.
Why it matters. The rule of thumb we drew from it did not hold up. On the original task the cheapest model that helped at all was also the best one, so we wrote down 'use the cheapest one that works'. On the new task the curve has a dip in the middle: the cheapest model that helps is a poor choice, and following our own rule would cost about double. We also found something the original could not have seen, because its range started at the best point and never went below it: a model being reused by somebody else needs to be more fully trained than one being reused by its own author to be worth the same.
The rest of this page is the technical record: the design, every number, and the limits. It is written for a reviewer, and you do not need it to have understood the result above.
New here? How to read a research record
- Start at the verdict. Every record states, before the experiment was run, what result would have made us abandon the idea. That is the "kill test". Then it says whether the test fired. Nothing gets reinterpreted after the fact.
- Numbers in square brackets are uncertainty.
23.4 [18.1, 28.7]means our best estimate is 23.4 and the true value is probably somewhere in that range. If a range includes zero, we cannot claim an effect. - Results that rule an idea out are kept. Roughly half of what is published here says an approach did not work, including plenty of our own. Those pages are the output, not a shortfall: knowing which direction is a dead end is what lets the next experiment go somewhere better, and most of what we now rely on came out of understanding why something else fell short. Work that only publishes what worked is not measuring anything.
- Read the Limits section. Every record ends with what it does not show. It is the most honest part of any experiment and usually the shortest.
- Pro tip: the figures near the top are designed to carry the result on their own. If you read nothing else, read the caption under each one, which says what it shows and what to take from it.
EXPLORATORY. Not a preregistered study. Local CPU, 7 donor lengths across 2 arms over 6 seeds, no GPU, no cost.
Program v2 Bucket R, item R5. Decisive computation: analysis/donor_economics_second_task.pyanalysis/donor_economics_second_task.jsonpython analysis/donor_economics_second_task.py in about twenty-five minutes on a throttled laptop CPU; --reuse re-derives every endpoint.
### CORRECTED 2026-09-04 by R11 The shared-donor section below is half right and the half that is wrong is the headline. R11 ran five further shared donors at four lengths. This record's shared donor was the worst of the six, and donor identity alone spans31.7steps at a 160-step donor, more than the27.5this record attributed to sharing. Corrected numbers, with the donor as the unit of observation: the own-minus-shared gap is12.6steps at 160 (not27.5),8.8at 240 (not22.5),6.3at 400 (not8.4) and4.6at 800 (not1.7), with the own arm outside the donor-level interval at every length. So the bespoke advantage is real, smaller than reported at short lengths, and it does not close at convergence. What collapses with donor length is the variance across donors,31.7to4.2, which this record read as a collapsing mean. Below about 240 steps, which donor you happen to have matters more than whether it is yours. Everything else in this record stands, including the break-even table, the U-shape, and the withdrawal of P8's "cheapest useful donor" advice. Nothing above is rewritten.
The question
R1 named 19 surviving claims resting on a single task and deliberately ranked none of them, saying the order should follow what other results depend on. By that rule P8 is first: it is the programme's only claim with a break-even attached, 4.8 receivers per donor, and the whole transfer thread's economics rest on it. This is the first of the nineteen to be re-tested.
Kill test, fixed before execution, using P8's own constant: no donor length on dispatch-copy-8lag achieves a break-even under 10 receivers.
Prior recorded in advance: the break-even reproduces within a factor of two, the useful donor length shifts later, and "the cheapest useful donor wins" survives. The first two were right and the third was wrong, which is the useful part.
Anchor: Q4's same-task dispatch cell reproduces at -90.0, exactly.
Result: the kill test does not fire
Donor length, the receiver's head start, and receivers needed for the donor to pay for itself.
| Donor steps | Own donor | Pays at | Shared donor | Pays at |
|---|---|---|---|---|
| 40 | +30.8 [+23.1, +38.6] | delays | +50.0 [+42.6, +57.4] | delays |
| 80 | +10.0 [+1.9, +18.1] | delays | +33.3 [+26.2, +40.5] | delays |
| 120 | -15.0 [-29.1, -0.9] | 8.0 | +8.3 [-6.0, +22.7] | delays |
| 160 | -41.7 [-52.0, -31.3] | 3.8 | -14.2 [-27.2, -1.1] | 11.3 |
| 240 | -66.7 [-75.9, -57.5] | 3.6 | -44.2 [-50.3, -38.0] | 5.4 |
| 400 | -84.2 [-91.1, -77.2] | 4.8 | -75.8 [-83.6, -68.1] | 5.3 |
| 800 | -90.0 [-99.4, -80.6] | 8.9 | -88.3 [-95.5, -81.2] | 9.1 |
Best shared-arm break-even: 5.3 receivers, at a 400-step donor. P8 on delayed-copy: 4.8 at a 120-step donor.
The number survives a change of task, within 10% on the arm the economics actually rest on. That makes P8 the first of R1's nineteen to be re-tested and the first to hold.
The shape does not survive, and that is the finding
P8's practical advice was "the cheapest useful donor is the best one", because on delayed-copy the break-even worsened monotonically with donor length: 4.8 at 120 steps, 6.2 at 200, 11.2 at 400.
On dispatch the curve is U-shaped. It falls from 11.3 to 5.4 to 5.3 and then rises to 9.1. There is an optimum in the middle, and the cheapest useful donor is not at it: at 120 steps the shared donor still delays the receiver, and at 160 it pays at 11.3, over P8's own bar.
So P8's number is general and P8's advice is not. Following "take the cheapest donor that helps" on this task picks a 160-step donor and a break-even of 11.3, which fails the bar. Taking the best picks 400 steps and 5.3. The difference between the rule and the optimum is a factor of two.
The likely reason is that P8's ladder started at the optimum rather than below it. On delayed-copy the first length that helps at all is 120, and nothing cheaper was useful, so only the rising half of the U was ever visible.
A shared donor needs to be more converged than a bespoke one
P8 found one donor given to six receivers scored -25.0 [-29.7, -20.3], indistinguishable from six bespoke ones, and the amortisation argument rests on that.
Here the two arms are clearly different at short lengths and converge at long ones:
| Donor steps | Own | Shared | Gap |
|---|---|---|---|
| 160 | -41.7 | -14.2 | 27.5 |
| 240 | -66.7 | -44.2 | 22.5 |
| 400 | -84.2 | -75.8 | 8.4 |
| 800 | -90.0 | -88.3 | 1.7, intervals overlapping |
P8's equivalence holds only for a converged donor. A half-trained donor is worth much less to a stranger than to the receiver whose seed it shares, and the gap closes as the donor converges. That is a new constraint on the amortisation argument and it is visible only because this ladder ran lengths below the optimum, which P8's did not.
What stands
- P8's break-even survives a change of task,
5.3against4.8, on the arm that carries the claim. The first of R1's nineteen to be re-tested and it holds. - P8's advice does not. "Cheapest useful donor" is a
delayed-copyartefact; the real curve is U-shaped and following the rule here costs a factor of two. - A shared donor must be more converged than a bespoke one to be worth the same, which P8 could not have seen because its ladder began at the optimum.
- P8 does not need a correction banner. Its number holds and its advice was stated about the task it measured. What this adds is scope, and the record it belongs in is this one.
Limits
- Two tasks is two tasks. The U-shape is now the better-supported description because it contains the monotone one as a special case, but that is an argument rather than a measurement, and a third task would test it.
- The ladder is scaled by
1.95, the ratio of the two tasks' own learning times. A different scaling would move which rung is cheapest-useful and could move the apparent optimum. The break-even numbers themselves are ratios and are not affected. - One width (
48), one learning rate, six seeds, all inherited. - The shared donor is one seed. P8 had the same limitation and said so: the shared arm shows the assumption holds for that donor, not how far it extends across donors.
- Break-even counts donor steps against receiver steps, which assumes a step costs the same in both. On a fixed width and task it does. Q9 is the record of what happens when a unit like that is assumed rather than checked.
Terms on this page
Every piece of vocabulary this record uses, in plain language. Generated from the text above, so it cannot drift out of step with it.
- kill test
- A condition written down before running the experiment that says what result would make us abandon the idea. Fixing it in advance is what stops a disappointing result being reinterpreted as an encouraging one.
- learning rate
- How big a step training takes each time it updates the model. Too small and nothing happens; too big and it never settles.
- seed
- The number that fixes all the randomness in a training run. Same seed, same run. Running several seeds is how you tell a real effect from a lucky one.
- variance
- How spread out a set of numbers is. Rising variance in a signal means it is becoming more erratic.
- width
- How many internal numbers a model uses at each layer. The usual way we vary model size in these experiments.
Get new results as we publish them
Roughly monthly, one finding per email, in plain English first. Including the approaches that turned out not to work, which are usually the useful ones. No sales email.
Double opt-in: we send a confirmation link and add nobody who does not click it. One-click unsubscribe on every email.