
One Number for Every Size
Ongoing research. This is an experimental result from active work, not a settled conclusion. The numbers are what we measured and the method is described so you can judge it, but the programme is still running and later experiments may revise what it means.
A note on the language in these records. This is a working laboratory notebook for research into training AI models more cheaply and efficiently, so you will read that an approach did not work, that a result did not hold up, or that one method was worse than another. That is the research doing its job, not a verdict on the engineering we deliver to clients. Ruling an approach out is how the search narrows, and these are the pages that teach us the most: nearly every technique we now rely on came from understanding why something else fell short. Testing our own ideas at least as hard as anyone else's is the point of publishing them. More about this programme and why we run it.
Part of a bigger question: How do we know our own results are real? – Repeatedly, the control rather than the measurement decided the result -- and several striking findings dissolved when the right comparison was finally run.
In plain English
What we asked. One of our results depends on an early-warning measurement that trains a small model of its own alongside the real one, which is not free. We published a figure for what that costs, 55% of the training budget, and then quoted that figure in eight separate results as the reference price of running a measurement. It turns out to have been computed in a unit that cancels out of its own ratio, so it could not respond to model size no matter what happened.
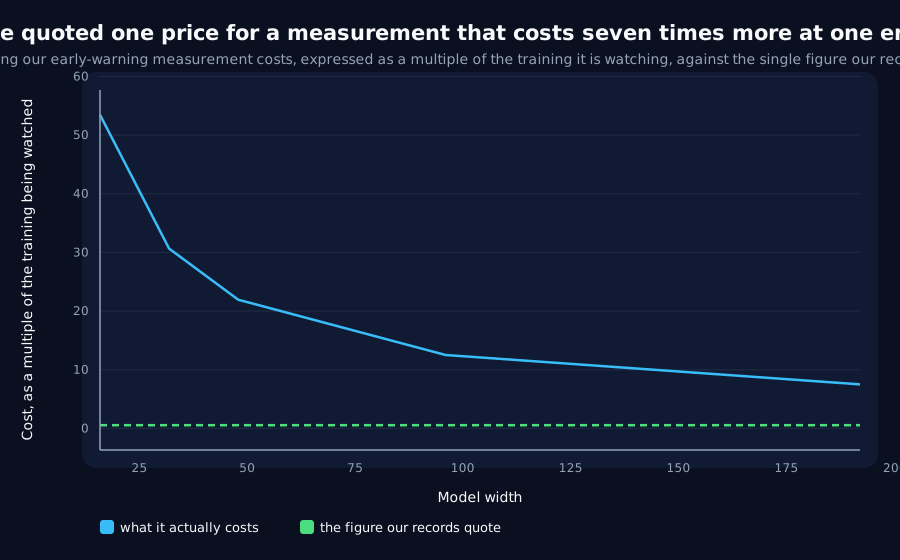
What we found. Counted properly, in the arithmetic actually performed, the measurement costs about fifty times the training it is watching on our smallest models and about seven times on our largest. Two things are true at once and both matter: it gets dramatically cheaper as models grow, and it never once becomes cheaper than the thing it is watching. The single published figure could show neither.
Why it matters. The second finding runs the other way and is more cheerful. Our one positive efficiency result - a way of switching off part of the model late in training - was measured with a stopwatch on a laptop, and reported a 7% saving. On models this small a stopwatch mostly measures the software framework rather than the arithmetic, and the arithmetic says the saving should be nearly five times larger. An understatement is as much an error as an overstatement, and it is less likely to be caught, because nobody re-examines a result that looks modest. The transferable rule: price a measurement in a unit that can respond to whatever you are varying, and check where a number travelled before correcting it - fixing one page does not reach the seven that quote it.
The rest of this page is the technical record: the design, every number, and the limits. It is written for a reviewer, and you do not need it to have understood the result above.
New here? How to read a research record
- Start at the verdict. Every record states, before the experiment was run, what result would have made us abandon the idea. That is the "kill test". Then it says whether the test fired. Nothing gets reinterpreted after the fact.
- Numbers in square brackets are uncertainty.
23.4 [18.1, 28.7]means our best estimate is 23.4 and the true value is probably somewhere in that range. If a range includes zero, we cannot claim an effect. - Results that rule an idea out are kept. Roughly half of what is published here says an approach did not work, including plenty of our own. Those pages are the output, not a shortfall: knowing which direction is a dead end is what lets the next experiment go somewhere better, and most of what we now rely on came out of understanding why something else fell short. Work that only publishes what worked is not measuring anything.
- Read the Limits section. Every record ends with what it does not show. It is the most honest part of any experiment and usually the shortest.
- Pro tip: the figures near the top are designed to carry the result on their own. If you read nothing else, read the caption under each one, which says what it shows and what to take from it.
EXPLORATORY. Not a preregistered study. No training at all. It reads committed records, committed pilot output and committed settings. Seconds on a laptop CPU, no GPU, no cost.
Program v2 Bucket Q, item Q9. Decisive computation: analysis/cost_unit_audit.pyanalysis/cost_unit_audit.jsonpython analysis/cost_unit_audit.py.
The question
Q1 found that J7's 55.4% counts scored rows in numerator and denominator, so the factor cancels and the ratio reduces to crossing_step PROBE_BATCH / (EVAL_EVERY budget_samples), a quantity in which width does not appear at all. Priced in the arithmetic actually performed, the same probe cost 188.4% at width 48 and 27.3% at width 192.
That is a property of the unit, not a mistake specific to one record. This programme's standing rule already required pricing the instrument in the same units as the benefit; it did not require that those units be able to move with what is being varied.
Kill test, fixed before execution: no published efficiency figure changes by more than 2x when recomputed in arithmetic. Then J7's was the unlucky one.
What we found: the kill test does not fire, and the blind figure is the archive's yardstick
55.4% appears in eight committed records: compression-view, dispatch-dependence, effective-context, function-space-work, schedule-versus-probe, spend-the-cheap-lead, plus J7 itself and Q1. It is quoted as the reference price for what an instrument costs, in records that vary width and task, and it is the one figure now known to be blind to both.
Every published cost figure this audit could locate, with the unit it is denominated in:
| Figure | Published | Unit | Class |
|---|---|---|---|
| J7's probe overhead | 55.4% | scored-rows ratio | blind |
| K2's freeze saving | 7.1% | wall-clock ratio | platform-bound |
| Penalty overhead across width (M-era) | +33.4% to +58.3% | wall-clock ratio | platform-bound |
| F1's gradient-variance indicator | "nearly free" | what the loop already computes | responsive |
| N14's offline schedule | zero | computed from task settings | responsive |
Both figures that could be re-priced move by more than 2x:
| Figure | Factor | |
|---|---|---|
| J7's probe overhead | x3.40 | 55.4% in rows against 188.4% in arithmetic, width 48 |
| K2's freeze saving | x4.60 | a frozen step timed 13.1% cheaper against 60.0% modelled |
The probe, priced in a unit that moves
One probe fit, expressed as the training it costs, across J5's width ladder at its own task (lag 4):
| Width | One fit, in training steps | Cost rate while watching |
|---|---|---|
| 16 | 267.3 | 53.5x |
| 32 | 153.3 | 30.7x |
| 48 | 109.7 | 21.9x |
| 96 | 62.6 | 12.5x |
| 192 | 37.5 | 7.5x |
"While watching" is the cost rate during the stretch the probe is running, since it fits every five steps. At every width tested the instrument costs several times the training it observes, 53x at width 16, still 7.5x at width 192. It falls 7.1x across the ladder, which is the real and substantial improvement Q1 predicted, and it does not reach parity anywhere in this archive.
This ladder is at lag 4. Q1's 24.1 steps per fit at width 192 is at lag 11, where a sequence scores five positions instead of twelve so the probe fits on fewer rows. Both are correct for their own configuration, and that is the point: a cost is a property of a configuration, not of an instrument, and quoting one number for an instrument across an archive that varies the configuration is the error this audit is about.
K2's understatement points the other way, and it is good news
K2's 7.1% is a wall-clock measurement: a frozen training step was timed 13.1% cheaper on a throttled laptop CPU. The arithmetic says freezing the recurrence removes two thirds of the backward pass over 6W^2 of 6W^2 + W*V matmuls, 60.0% of a step at width 48.
The gap is framework overhead. overhead-width-scaling-pilot-v1.md had already measured it from the other side, fitting the training step at d^1.08 where the arithmetic says d^2, and saying in its own record that the step is "partly overhead-bound rather than compute-bound at these sizes".
So K2's only-positive-result understates itself by about 4.6x. Where arithmetic dominates, freezing the recurrence from its boundary offset could be worth something nearer a third of training cost than 7.1%. Q5 measures the timed and modelled forms side by side at two widths.
What to take from this
- Price a measurement in a unit that can respond to whatever you are varying. A ratio whose unit cancels the axis under test will answer a different question confidently.
- A wall-clock ratio on a small model is a measurement of your framework. It is honest for that machine and it is not a property of the method. Quote the modelled figure beside it; the two disagreeing by
4.6xis itself the finding. - Check where a number travelled before correcting it.
55.4%was cited in eight records. A correction to one record does not reach the seven that quote it, which is why this audit exists and why the count is in the committed output. - An understatement is as much an error as an overstatement, and it is less likely to be caught, because nobody re-examines a result that looks modest.
Limits
- The table is hand-built. There is no way to extract "what axis does this record vary" from prose, so the five rows were assembled by reading the records. Each names the committed source its value can be checked against, and the audit will not silently gain a row.
- Two of the five could be re-priced; the other three are either structurally free or have no committed settings to re-price from.
overhead-width-scaling-pilot-v1.mdhas no committed JSON at all, which is a separate gap. - The arithmetic model counts multiply-accumulates in the GRU's gates and head and takes backward as twice forward. It ignores memory traffic, which on a real accelerator can dominate. It is a better unit than rows, not a perfect one.
- **This audits published figures, not published conclusions.** Neither J7's nor K2's verdict changes: J7's instrument was already an order of magnitude the wrong way, and K2's saving being larger does not make its timing matter.
Terms on this page
Every piece of vocabulary this record uses, in plain language. Generated from the text above, so it cannot drift out of step with it.
- freezing
- Stopping one part of a model from changing while the rest carries on learning. A way of asking what that part contributes, by taking it away.
- gradient
- The direction and amount by which each of a model's internal numbers should change to do slightly better. Training is repeatedly following it.
- GRU
- Gated Recurrent Unit. A compact design for processing sequences one item at a time, with internal switches controlling what it keeps in memory.
- kill test
- A condition written down before running the experiment that says what result would make us abandon the idea. Fixing it in advance is what stops a disappointing result being reinterpreted as an encouraging one.
- parity
- Whether a count is odd or even. A classic test puzzle for models, because the answer flips with every single item and cannot be guessed from a rough impression.
- probe
- A small separate model trained to read information out of a bigger model's internals, used as a measuring instrument rather than as a product.
- variance
- How spread out a set of numbers is. Rising variance in a signal means it is becoming more erratic.
- width
- How many internal numbers a model uses at each layer. The usual way we vary model size in these experiments.
Get new results as we publish them
Roughly monthly, one finding per email, in plain English first. Including the approaches that turned out not to work, which are usually the useful ones. No sales email.
Double opt-in: we send a confirmation link and add nobody who does not click it. One-click unsubscribe on every email.