
The Shape Held, the Level Did Not
Ongoing research. This is an experimental result from active work, not a settled conclusion. The numbers are what we measured and the method is described so you can judge it, but the programme is still running and later experiments may revise what it means.
A note on the language in these records. This is a working laboratory notebook for research into training AI models more cheaply and efficiently, so you will read that an approach did not work, that a result did not hold up, or that one method was worse than another. That is the research doing its job, not a verdict on the engineering we deliver to clients. Ruling an approach out is how the search narrows, and these are the pages that teach us the most: nearly every technique we now rely on came from understanding why something else fell short. Testing our own ideas at least as hard as anyone else's is the point of publishing them. More about this programme and why we run it.
Part of a bigger question: How do we know our own results are real? – Repeatedly, the control rather than the measurement decided the result -- and several striking findings dissolved when the right comparison was finally run.
In plain English
What we asked. While checking how we price our own measurements, we noticed that one of our older results had numbers which existed only in its write-up. The experiment printed a table to the screen and saved nothing, so nobody could ever check it. Every other experiment here saves its output. This one mattered more than most: its table is what closed off the last hope for the method our first year of work was about.
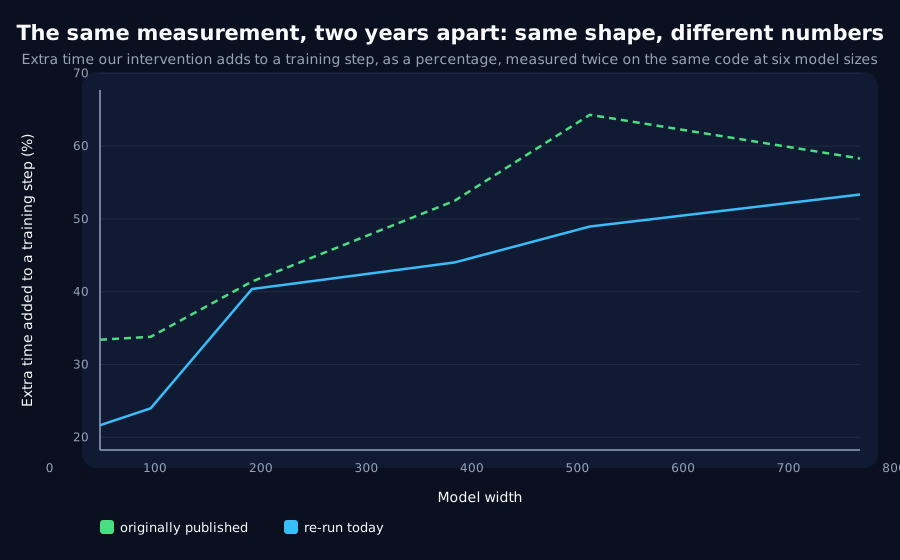
What we found. So we re-ran the identical code on an idle machine. The result splits cleanly in two. The rate at which the cost grows with model size came back almost exactly, within a twentieth of the original, and that rate is what the conclusion actually rested on: the intervention gets more expensive relative to training as models grow, so making models bigger does not rescue it. The individual percentages missed by up to fifteen points.
Why it matters. That split is the useful part, and it is a rule rather than an anecdote. A growth rate is a property of the algorithm. A percentage measured with a stopwatch is a property of the computer you ran it on, and our machine happens to be about twenty per cent slower today than it was then. Both versions of the table are on this page so a reader can see the disagreement rather than a summary of it, and the experiment now saves its output like everything else. We expected this to be housekeeping and it turned into a measurement.
The rest of this page is the technical record: the design, every number, and the limits. It is written for a reviewer, and you do not need it to have understood the result above.
New here? How to read a research record
- Start at the verdict. Every record states, before the experiment was run, what result would have made us abandon the idea. That is the "kill test". Then it says whether the test fired. Nothing gets reinterpreted after the fact.
- Numbers in square brackets are uncertainty.
23.4 [18.1, 28.7]means our best estimate is 23.4 and the true value is probably somewhere in that range. If a range includes zero, we cannot claim an effect. - Results that rule an idea out are kept. Roughly half of what is published here says an approach did not work, including plenty of our own. Those pages are the output, not a shortfall: knowing which direction is a dead end is what lets the next experiment go somewhere better, and most of what we now rely on came out of understanding why something else fell short. Work that only publishes what worked is not measuring anything.
- Read the Limits section. Every record ends with what it does not show. It is the most honest part of any experiment and usually the shortest.
- Pro tip: the figures near the top are designed to carry the result on their own. If you read nothing else, read the caption under each one, which says what it shows and what to take from it.
EXPLORATORY. Not a preregistered study. Local CPU, exclusive use of the machine, no GPU, no cost. About fifteen minutes.
Program v2 Bucket Q, item Q10. Decisive computation: analysis/overhead_width_scaling.pyanalysis/overhead_width_scaling.jsonpython analysis/overhead_width_scaling.py, on an otherwise idle machine.
The question
Q9 went looking for published cost figures whose unit could not respond to what their record varied, and found something else on the way: one record in this archive whose numbers live only in its prose. overhead-width-scaling-pilot-v1.md
Q9 also classified those numbers as platform-bound: a wall clock on small models measures framework overhead as much as it measures the method, which the record itself had noticed from the other side by fitting the training step at d^1.08 where the arithmetic says d^2.
So the re-run is not a formality. If the figures are a property of a machine nobody recorded, they should not reproduce.
Kill test, fixed before execution: the re-run reproduces the published exponents, k = 1.08 for the training step and k = 1.33 for the SVD and penalty, within 0.1.
Result: the shape reproduces, the levels do not
| Width | Published overhead | Re-run overhead | Published task-only | Re-run task-only | Machine |
|---|---|---|---|---|---|
| 48 | +33.4% | +21.7% | 0.437s | 0.524s | 1.20x |
| 96 | +33.8% | +24.0% | 0.662s | 0.871s | 1.32x |
| 192 | +41.4% | +40.4% | 1.192s | 1.420s | 1.19x |
| 384 | +52.5% | +44.0% | 2.824s | 3.361s | 1.19x |
| 512 | +64.3% | +49.0% | 4.117s | 5.059s | 1.23x |
| 768 | +58.3% | +53.4% | 9.267s | 9.574s | 1.03x |
The exponents reproduce and the kill test fires:
| Fit | Published | Re-run | Difference |
|---|---|---|---|
| task-only GRU step | 1.08 | 1.03 | 0.05 |
| SVD and penalty cost | 1.33 | 1.38 | 0.05 |
| overhead ratio | ~0.25 | 0.35 | , |
Both inside the 0.1 tolerance, and the structural conclusion is exactly reproduced: the intervention's cost grows faster with width (1.38) than the training step it is attached to (1.03), so scaling up makes the penalty relatively more expensive rather than amortising it. That was the record's whole point and it survives.
The individual percentages move by up to 15 percentage points. The published range was "33% to roughly 60%"; today it is 22% to 53%. The published conclusion is untouched, overhead never approaches the 1-2% that would be needed to close a 57x break-even gap, and both ranges are two orders of magnitude away from it.
Two things worth noticing
The machine is uniformly about 1.2x slower today, at five of six widths, and only 1.03x at
- A uniform slowdown cannot change a ratio, so the level shift is not simply "a slower machine":
it is the fixed per-step overheads being a different share of a different machine's step. That is the platform-bound mechanism, visible directly.
Today's sweep is monotonic and the published one is not. The published table dips at 768 (64.3% then 58.3%) and the record calls it "noise at the top point"; today's runs 21.7, 24.0, 40.4, 44.0, 49.0, 53.4 with no dip. The re-run is the cleaner of the two, which is a mild argument for quoting it.
What to take from this
- An exponent is a property of the algorithm; a percentage is a property of the machine. The same fifteen-minute pilot reproduced one to
0.05and missed the other by15points. When a wall-clock table has to be quoted, quote the exponent and treat the levels as an illustration. - A record whose numbers exist only in prose cannot be checked, and the check was cheap. The pilot now writes its output beside every other pilot's, and both tables are in this record so a reader can see the disagreement rather than a summary of it.
- The value here was in the re-running, not the result. The expected payoff was a provenance tidy-up; what it produced was a measured demonstration of Q9's platform-bound category, on an axis Q9 could not reach.
Limits
- One re-run on one machine. Two measurements disagreeing establishes that the level is not stable; it does not say which is right, and neither is, in the sense that neither is a property of the method.
- The published run did not record its machine, and this one now does. That gap prompted
machine_provenance()inlatent_pretraining.execution.resources, which any pilot reporting a duration, rate or overhead ratio should now call. The committed output carries it. Two honesty notes about that block. It was captured immediately after this run rather than during it, the pilot gained the capability in the same session and the table was not re-measured, and the JSON says so. And it recordsthrottled: false: this pilot is deliberately not throttled, since constructing aPilotThrottleto name a profile would cap torch's thread pools and change the very measurement being recorded. The re-run therefore had 16 threads; what the published run had is unknown, and that is one plausible share of the level difference. - The published record is not corrected, because nothing in it is wrong: its conclusion follows from its exponents and its exponents reproduce. This record is appended evidence, not a correction.
- The
0.1tolerance was chosen before running and is generous. Both differences came in at0.05, so the test would still have passed at half the tolerance.
Terms on this page
Every piece of vocabulary this record uses, in plain language. Generated from the text above, so it cannot drift out of step with it.
- exponent
- The number in a power law that says how strongly one quantity responds to another. A bigger exponent means a steeper response to the same doubling.
- GRU
- Gated Recurrent Unit. A compact design for processing sequences one item at a time, with internal switches controlling what it keeps in memory.
- kill test
- A condition written down before running the experiment that says what result would make us abandon the idea. Fixing it in advance is what stops a disappointing result being reinterpreted as an encouraging one.
- SVD
- Singular Value Decomposition. A standard mathematical procedure that breaks a table of numbers into its independent directions, strongest first. It is how we measure internal structure throughout this work.
- width
- How many internal numbers a model uses at each layer. The usual way we vary model size in these experiments.
Get new results as we publish them
Roughly monthly, one finding per email, in plain English first. Including the approaches that turned out not to work, which are usually the useful ones. No sales email.
Double opt-in: we send a confirmation link and add nobody who does not click it. One-click unsubscribe on every email.