
The Same Numbers, A Longer Run
Ongoing research. This is an experimental result from active work, not a settled conclusion. The numbers are what we measured and the method is described so you can judge it, but the programme is still running and later experiments may revise what it means.
A note on the language in these records. This is a working laboratory notebook for research into training AI models more cheaply and efficiently, so you will read that an approach did not work, that a result did not hold up, or that one method was worse than another. That is the research doing its job, not a verdict on the engineering we deliver to clients. Ruling an approach out is how the search narrows, and these are the pages that teach us the most: nearly every technique we now rely on came from understanding why something else fell short. Testing our own ideas at least as hard as anyone else's is the point of publishing them. More about this programme and why we run it.
Part of a bigger question: How do we know our own results are real? – Repeatedly, the control rather than the measurement decided the result -- and several striking findings dissolved when the right comparison was finally run.
In plain English
What we asked. The day before this, we published a finding: the shape of a model's internal weights changes noticeably at the moment it starts performing, more than at a moment picked at random. We had even checked it across model sizes, because a rule we had written that morning told us to. This experiment was meant to recheck it one more way.
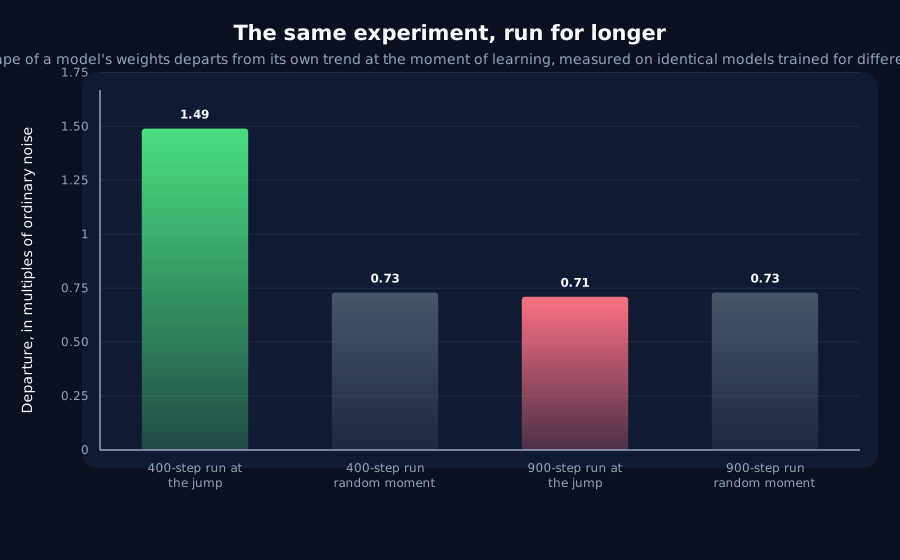
What we found. It does not survive. Taking the identical models, the identical task and the identical random seeds, and changing only how long we trained before stopping, the measurement falls from clearly above the noise to indistinguishable from it. The finding was about where we stopped training, not about the moment of learning, and we have withdrawn it.
Why it matters. The reason is worth understanding because it is easy to repeat. The measurement compares what happens at the moment of learning against a straight line fitted to the rest of the run. Train for longer and that line is fitted mostly to late training instead, so it tilts, and the moment of learning no longer stands out against it. Nothing about the model changed; the yardstick did. What makes this uncomfortable is that the original experiment did include a careful check across model sizes, and that check felt like diligence. It was diligence aimed at the wrong thing: we varied the model size while holding both the task and the run length fixed, and both of those turned out to matter more than size did. Two hidden problems in one small experiment, and neither was the one we were guarding against.
The rest of this page is the technical record: the design, every number, and the limits. It is written for a reviewer, and you do not need it to have understood the result above.
New here? How to read a research record
- Start at the verdict. Every record states, before the experiment was run, what result would have made us abandon the idea. That is the "kill test". Then it says whether the test fired. Nothing gets reinterpreted after the fact.
- Numbers in square brackets are uncertainty.
23.4 [18.1, 28.7]means our best estimate is 23.4 and the true value is probably somewhere in that range. If a range includes zero, we cannot claim an effect. - Results that rule an idea out are kept. Roughly half of what is published here says an approach did not work, including plenty of our own. Those pages are the output, not a shortfall: knowing which direction is a dead end is what lets the next experiment go somewhere better, and most of what we now rely on came out of understanding why something else fell short. Work that only publishes what worked is not measuring anything.
- Read the Limits section. Every record ends with what it does not show. It is the most honest part of any experiment and usually the shortest.
- Pro tip: the figures near the top are designed to carry the result on their own. If you read nothing else, read the caption under each one, which says what it shows and what to take from it.
EXPLORATORY. Not a preregistered study. Local CPU, 3 widths x 6 seeds plus a 2 x 4 run-length check, no GPU, no cost.
Program v2 Bucket P, item P12, first of four cases. Decisive computation: analysis/spectra_matched.pyanalysis/spectra_matched.jsonpython analysis/spectra_matched.py; --reuse re-derives every endpoint.
The question
O7 reported the weight matrix's spectral entropy and top singular-value share departing from their own trend at the transition, beating a random-time-matched window at widths 24 and 48 and failing at width 96, and published that as the sixth instance of a fade-with-size pattern. P11 then showed the pattern is, in the one case it re-tested, an artefact of sweeping width at fixed task difficulty.
Kill test, fixed before execution: the departure still fails to clear 1.0 at width 96 on a matched-difficulty ladder. Then O7's reading stands.
Anchor: O7's committed output must show 1.49 at width 48 and 0.76 at width 96. It does, and the script exits 2 otherwise.
What we found, and it is not what either side expected
On P11's matched ladder, with the run extended to 900 steps so every width has room past its transition:
| Width | Lag | Transition | spectral_entropy | at a random window | top_share | at a random window |
|---|---|---|---|---|---|---|
| 24 | 4 | 131.7 | 0.78 [0.56, 0.99] | 0.61 | 0.40 [0.24, 0.56] | 0.75 |
| 48 | 7 | 133.3 | 1.52 [1.43, 1.61] | 0.40 | 1.07 [1.02, 1.13] | 0.48 |
| 96 | 8 | 119.2 | 1.37 [1.28, 1.47] | 3.22 | 1.02 [0.96, 1.09] | 9.10 |
The kill test does not fire, the departure clears 1.0 at width 96, where O7 had it at 0.76. But this is not a positive, because at width 96 the random-time-matched window departs two to nine times more than the transition window does. The series is simply not well described by a line at that setting, and the transition is not special. Under O7's own two-part rule, clear the noise and beat the random window, width 96 fails on the second part.
And width 24 contradicts O7 directly. Same width, same lag, same seeds: O7 read 1.49, this reads 0.78.
The cause, checked rather than guessed
The only difference at that point is run length: O7 ran 400 steps, this ran 900. Holding width, lag and seeds fixed and varying only that:
| Run length | spectral_entropy | at a random window | top_share |
|---|---|---|---|
| 400 steps | 1.49 [1.26, 1.72] | 0.73 | 1.33 [1.21, 1.45] |
| 900 steps | 0.71 [0.39, 1.02] | 0.73 | 0.36 [0.18, 0.54] |
O7's entire effect disappears when the run is longer. Nothing else changed.
The mechanism is the statistic's own construction. The departure is measured against a line fitted to everything outside ±30 of the transition. At 400 steps that is roughly 100 pre-transition points against 240 after; at 900 steps it is 100 against 740, so the fit is dominated by late training, its slope changes, and the transition window stops looking anomalous relative to it.
The trend-departure gate is not run-length invariant. That is a third confound, independent of the width one P11 found, and it applies to any use of this gate: including A13, which is where the gate came from. A13 reported a null, which is far less alarming than a positive built on it, but its run length should be stated when it is next cited.
What this does to O7
O7's central claim does not reproduce. Its headline was that program v1's negative does not extend to the weight spectrum. On the evidence here, the departure it measured is a property of a 400-step run rather than of the transition, and at 900 steps it is gone at width 24 and beaten by its own control at width 96. A correction banner is appended to O7's record.
Only width 48 survives, at 1.52 [1.43, 1.61] against a random window of 0.40. One rung of a three-rung ladder, on a statistic now known to move with run length, is not a finding. It is at most a reason to build a run-length-invariant version of the measurement, which is filed as P13.
P11 is unaffected. Its endpoint is a head start in steps and as a share of the run, not a trend-departure, so nothing here touches it.
The uncomfortable part, again
O7 was published with a width sweep specifically because a rule written hours earlier demanded one, and that felt like diligence. It was diligence aimed at the wrong axis: the sweep varied width while holding both task difficulty and run length fixed, and both turned out to matter more than width did. Two confounds, in one small experiment, neither of them the one being controlled for.
Limits
- The run-length check uses four seeds, not six, and one width. It is decisive for the discrepancy it explains and is not a sweep.
- Only
spectral_entropyandtop_shareare examined here; O7's other four quantities did nothing in either version. - Whether a run-length-invariant version of the statistic: fitting a fixed window either side, or normalising the fit range by the transition step, recovers a signal is not tested. That is P13, and this record makes no prediction about it.
- Three widths, one task family, one lever for difficulty.
Terms on this page
Every piece of vocabulary this record uses, in plain language. Generated from the text above, so it cannot drift out of step with it.
- confound
- A second explanation you did not control for. If bigger models both learn faster and score higher, then 'fast learners score higher' may be entirely about size and not about speed.
- kill test
- A condition written down before running the experiment that says what result would make us abandon the idea. Fixing it in advance is what stops a disappointing result being reinterpreted as an encouraging one.
- seed
- The number that fixes all the randomness in a training run. Same seed, same run. Running several seeds is how you tell a real effect from a lucky one.
- singular value
- A measure of how much a mathematical operation stretches things along one particular direction. The largest one describes the direction of strongest effect.
- slope
- How steeply one quantity changes as another does. A slope of one between a warning and the event it predicts means the warning shifts exactly in step with the event.
- width
- How many internal numbers a model uses at each layer. The usual way we vary model size in these experiments.
Get new results as we publish them
Roughly monthly, one finding per email, in plain English first. Including the approaches that turned out not to work, which are usually the useful ones. No sales email.
Double opt-in: we send a confirmation link and add nobody who does not click it. One-click unsubscribe on every email.