
The Rule Caught It The Same Day
Ongoing research. This is an experimental result from active work, not a settled conclusion. The numbers are what we measured and the method is described so you can judge it, but the programme is still running and later experiments may revise what it means.
A note on the language in these records. This is a working laboratory notebook for research into training AI models more cheaply and efficiently, so you will read that an approach did not work, that a result did not hold up, or that one method was worse than another. That is the research doing its job, not a verdict on the engineering we deliver to clients. Ruling an approach out is how the search narrows, and these are the pages that teach us the most: nearly every technique we now rely on came from understanding why something else fell short. Testing our own ideas at least as hard as anyone else's is the point of publishing them. More about this programme and why we run it.
Part of a bigger question: How do we know our own results are real? – Repeatedly, the control rather than the measurement decided the result -- and several striking findings dissolved when the right comparison was finally run.
In plain English
What we asked. Most of this project's early work concluded that reshaping what a model's internal activity looks like changes nothing useful. That conclusion was about the model's activity, though, and never about the model's own weights, which are a different thing. In eighty published results we had never measured whether the shape of the weights does anything at the moment a model suddenly starts performing.
What we found. It does, at small sizes. The weights change shape at that moment noticeably more than they do at a moment picked at random, which makes it a genuine finding in a place we had not looked. The individual adjustments made to those weights, on the other hand, do nothing at all. But at the largest model size we tried, the effect is gone.
Why it matters. This one is worth reading for the process rather than the result. The day before, another experiment had shown a promising result vanish once we tested it across model sizes, and it was the fifth time that had happened. So we wrote it down as a standing rule: check against size before publishing anything of that shape, not afterwards. This experiment was the first to hit the new rule, hours later, and the rule caught it. Without that check the headline would have been that we found something our earlier negative result had missed. That would have been true at the size we tested and misleading as a general claim. Rules like this are cheap to write and only prove themselves when they cost you a result you wanted.
The rest of this page is the technical record: the design, every number, and the limits. It is written for a reviewer, and you do not need it to have understood the result above.
New here? How to read a research record
- Start at the verdict. Every record states, before the experiment was run, what result would have made us abandon the idea. That is the "kill test". Then it says whether the test fired. Nothing gets reinterpreted after the fact.
- Numbers in square brackets are uncertainty.
23.4 [18.1, 28.7]means our best estimate is 23.4 and the true value is probably somewhere in that range. If a range includes zero, we cannot claim an effect. - Results that rule an idea out are kept. Roughly half of what is published here says an approach did not work, including plenty of our own. Those pages are the output, not a shortfall: knowing which direction is a dead end is what lets the next experiment go somewhere better, and most of what we now rely on came out of understanding why something else fell short. Work that only publishes what worked is not measuring anything.
- Read the Limits section. Every record ends with what it does not show. It is the most honest part of any experiment and usually the shortest.
- Pro tip: the figures near the top are designed to carry the result on their own. If you read nothing else, read the caption under each one, which says what it shows and what to take from it.
EXPLORATORY. Not a preregistered study. Local CPU, 6 seeds at 3 widths, no GPU, no cost.
Program v2 Bucket O, item O7. Decisive computation: analysis/weight_spectra.pyanalysis/weight_spectra.jsonpython analysis/weight_spectra.py; --reuse re-derives every endpoint.
CORRECTED 2026-09-01 by P12's first case. The central claim does not reproduce. Holding width, lag and seeds fixed and changing only the run length from 400 steps to 900, this record's1.49at width 24 becomes0.71[0.39, 1.02], and its1.33top-share becomes0.36. The effect disappears. The cause is the statistic's own construction: the departure is measured against a line fitted to everything outside±30of the transition, so a longer run puts far more post-transition data into the fit, changes its slope, and the transition window stops looking anomalous. The trend-departure gate is not run-length invariant -- a confound independent of the width one, and one that applies to A13, where the gate came from. On a matched-difficulty ladder at 900 steps, width 96 does clear1.0(1.37) -- but its random-time-matched window departs3.22, two to nine times more than the transition window, so it fails this record's own two-part rule. Only width 48 survives, on a statistic now known to move with run length, which is not a finding. The numbers below reproduce at 400 steps. What is withdrawn is the claim that they say anything about the transition. The width sweep this record was proud of varied width while holding both difficulty and run length fixed, and both mattered more than width did.
The question
Program v1's central negative is about activation geometry: reshaping the coordinates a model's activity is written in is free at every width, difficulty, subspace and weight tested. It says nothing about the weight matrices themselves or the updates applied to them, and in eighty records this programme has never measured their spectra.
Kill test, fixed before execution and borrowed verbatim from A13: no spectral quantity departs from its own trend inside the transition window by more than the noise in that trend. A13 applied exactly this gate to update cancellation and failed it, a 0.2005 swing across training with a departure at the transition of +0.0051 against noise of 0.0148.
Anchor enforced in code: the transition reproduces M3 at 86.7 [82.4, 91.0], checked against the width-48 runs only, since M3's is a width-48 number.
What we found
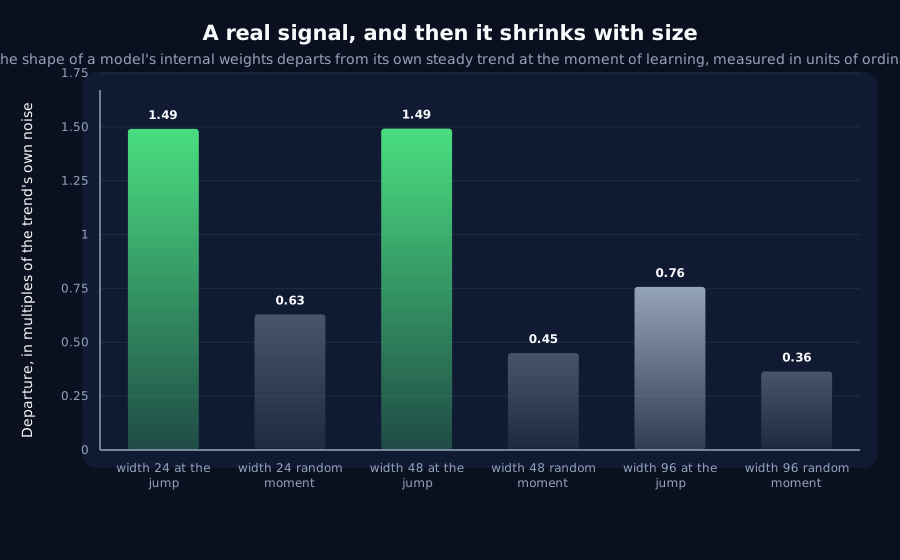
Departure from each quantity's own trend inside the transition window, in units of that trend's residual noise. Every quantity also gets a random-time-matched window of the same width, drawn independently of where the run's transition fell: without it, "departs at the transition" cannot be told from "is not a straight line".
| Quantity | At the transition | At a random window |
|---|---|---|
weight.stable_rank | 1.05 [0.99, 1.11] | 0.32 [0.07, 0.58] |
weight.spectral_entropy | 1.49 [1.40, 1.58] | 0.45 [0.02, 0.88] |
weight.top_share | 1.23 [1.11, 1.34] | 0.53 [0.14, 0.91] |
update.stable_rank | 0.27 [0.13, 0.42] | 0.75 [0.51, 0.99] |
update.spectral_entropy | 0.58 [0.35, 0.80] | 0.78 [0.26, 1.29] |
update.top_share | 0.63 [0.36, 0.90] | 0.66 [0.30, 1.03] |
The kill test does not fire at width 48. The weight matrix's spectral entropy and top-singular- value share both clear the noise and both beat their own random windows with non-overlapping intervals. Program v1's negative does not extend to the weight spectrum.
And the updates do nothing. All three update quantities sit below 1.0, and two of them score lower at the transition than at a random moment. Whatever happens, it is visible in the weights and not in the individual steps that produce them, which is consistent with A13, where the update's own waste measure was flat at the event.
Then the width sweep, which is the reason this is not a positive
Applying this programme's newest standing rule, written the same day after P9: width-sweep a timing-shaped result before publishing it.
| Width | spectral_entropy at the transition | vs random | top_share | vs random |
|---|---|---|---|---|
| 24 | 1.49 [1.36, 1.62] | 0.63 | 1.30 [1.21, 1.40] | 0.73 |
| 48 | 1.49 [1.40, 1.58] | 0.45 | 1.23 [1.11, 1.34] | 0.53 |
| 96 | 0.76 [0.59, 0.93] | 0.36 | 0.92 [0.74, 1.11] | 0.35 |
It closes. At width 96 neither quantity clears its own noise. This is the sixth result in this programme of the form "something happens at a particular moment in training" to fade with size, and the sixth to fade completely.
The rule that caught it was written hours earlier, off the back of the fifth. Had this record been written before that rule existed, its headline would have been "program v1's negative does not extend to the weight spectrum" and the width sweep would have been left as future work. That headline would have been true at the width tested and misleading as a general statement.
What it leaves
A narrow positive. At small widths the weight spectrum genuinely reorganises at the transition, beyond drift and beyond what a random window shows, and the applied updates do not. That is a real mechanistic fact about these models, it is somewhere program v1 never looked, and it is the first positive in Bucket O.
And no reason to build on it. The effect is modest even where it exists, 1.49 times the trend's own noise, and it is gone by width 96. B1 and B2 asked whether structure in the weight and update spaces deserves a GPU; on this evidence the update spaces do not, and the weight spectrum's signal is going the wrong way with scale.
Limits
- Three widths, six seeds each, one matrix. Only the recurrent hidden-to-hidden matrix is tracked, because that is where P1 to P9 located the transferable content. Other matrices may differ.
- Width 96 is still a toy. "Closes by 96" is a trend within a small range, not a statement about scale, the same caveat P9 carries.
- A departure-to-noise ratio of
1.49is a modest effect. It is reported as clearing the gate, not as a large signal, and the gate was set by A13 rather than chosen here. - The trend fit is linear. A quantity with genuine curvature outside the window would inflate the residual noise and make the gate harder to clear, so this is conservative, but the random-time control is what actually rules curvature out, and it is the load-bearing arm.
- One task, one learning rate, one optimizer.
Terms on this page
Every piece of vocabulary this record uses, in plain language. Generated from the text above, so it cannot drift out of step with it.
- confound
- A second explanation you did not control for. If bigger models both learn faster and score higher, then 'fast learners score higher' may be entirely about size and not about speed.
- kill test
- A condition written down before running the experiment that says what result would make us abandon the idea. Fixing it in advance is what stops a disappointing result being reinterpreted as an encouraging one.
- learning rate
- How big a step training takes each time it updates the model. Too small and nothing happens; too big and it never settles.
- optimizer
- The algorithm that decides how to change the model given the gradient. AdamW and SGD are two common choices and they behave differently.
- recurrent
- A design that reads a sequence one item at a time, carrying memory forward. The main alternative is attention, which looks at everything at once.
- residual
- How far the data sits from a proposed description of it, after the description has been fitted as well as it can be. A small residual means the description accounts for what was measured; a large one means something is missing.
- seed
- The number that fixes all the randomness in a training run. Same seed, same run. Running several seeds is how you tell a real effect from a lucky one.
- slope
- How steeply one quantity changes as another does. A slope of one between a warning and the event it predicts means the warning shifts exactly in step with the event.
- subspace
- A slice of a model's internal space: some directions kept, the rest ignored.
- width
- How many internal numbers a model uses at each layer. The usual way we vary model size in these experiments.
Get new results as we publish them
Roughly monthly, one finding per email, in plain English first. Including the approaches that turned out not to work, which are usually the useful ones. No sales email.
Double opt-in: we send a confirmation link and add nobody who does not click it. One-click unsubscribe on every email.