
The Cliff Survives Matching
Ongoing research. This is an experimental result from active work, not a settled conclusion. The numbers are what we measured and the method is described so you can judge it, but the programme is still running and later experiments may revise what it means.
A note on the language in these records. This is a working laboratory notebook for research into training AI models more cheaply and efficiently, so you will read that an approach did not work, that a result did not hold up, or that one method was worse than another. That is the research doing its job, not a verdict on the engineering we deliver to clients. Ruling an approach out is how the search narrows, and these are the pages that teach us the most: nearly every technique we now rely on came from understanding why something else fell short. Testing our own ideas at least as hard as anyone else's is the point of publishing them. More about this programme and why we run it.
Part of a bigger question: How do we know our own results are real? – Repeatedly, the control rather than the measurement decided the result -- and several striking findings dissolved when the right comparison was finally run.
In plain English
What we asked. We have one shortcut that saves training data, and it works on small models and fails on large ones. There is a well-known trap in that kind of comparison, and we have been caught by it before: if you grow the model while leaving the task the same, the model becomes progressively oversized for its job, and that alone can manufacture the fade you then report. Six of our own results turned out to be exactly that. So we ran it again with the task made harder at every step, to keep each model working equally hard.
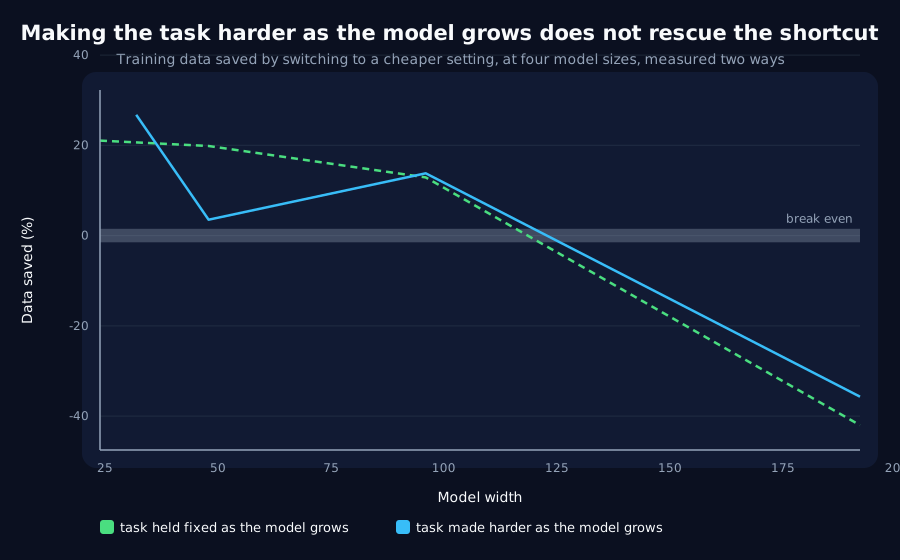
What we found. We predicted the failure would dissolve. It did not. The shortcut still fails badly on the largest model, which makes this the first effect in this programme to survive that check rather than come apart on it. That is worth saying plainly, because our recent record has been the opposite.
Why it matters. Two things stop us claiming more. The line is not a smooth decline: one of the four model sizes is well out of order, so there is no tidy law here, only a sign change. And our task-matching worked least well at exactly the largest size, which is the one carrying the conclusion. We have also noticed a suggestive pattern about where the shortcut flips, in both this experiment and the previous one. We are flagging it rather than claiming it, because a page or two ago we did claim a pattern that fitted every point we had, and it was withdrawn within the day.
The rest of this page is the technical record: the design, every number, and the limits. It is written for a reviewer, and you do not need it to have understood the result above.
New here? How to read a research record
- Start at the verdict. Every record states, before the experiment was run, what result would have made us abandon the idea. That is the "kill test". Then it says whether the test fired. Nothing gets reinterpreted after the fact.
- Numbers in square brackets are uncertainty.
23.4 [18.1, 28.7]means our best estimate is 23.4 and the true value is probably somewhere in that range. If a range includes zero, we cannot claim an effect. - Results that rule an idea out are kept. Roughly half of what is published here says an approach did not work, including plenty of our own. Those pages are the output, not a shortfall: knowing which direction is a dead end is what lets the next experiment go somewhere better, and most of what we now rely on came out of understanding why something else fell short. Work that only publishes what worked is not measuring anything.
- Read the Limits section. Every record ends with what it does not show. It is the most honest part of any experiment and usually the shortest.
- Pro tip: the figures near the top are designed to carry the result on their own. If you read nothing else, read the caption under each one, which says what it shows and what to take from it.
EXPLORATORY. Not a preregistered study. Local CPU, 60 training runs, no GPU, no cost.
Program v2 Bucket Q, item Q13. Decisive computation: analysis/cut_matched_ladder.pyanalysis/cut_matched_ladder.jsonpython analysis/cut_matched_ladder.py; --reuse re-derives every endpoint without retraining.
The question
Q12 found the batch cut paying +21.1%, +19.9%, +12.9% at widths 24, 48 and 96 on lag 4, then costing -42.0% at width 192. Monotone, so its kill test fired, but three widths sat within 8 points and the fourth fell 55: a cliff, not a fade.
Q12 is a fixed-task width sweep, which is P11's confound by construction. Its transition falls 138 to 39 across the sweep, so what "width" means there is really spare capacity. And Q12's own control column said the same from the other side: extra width stopped paying exactly where the cut stopped paying.
So: the same sweep on P12's difficulty-matched ladder, imported rather than retyped, switch still at x0.8 of each run's own transition.
Kill test, fixed before execution: on the matched ladder the saving is flat across width, spanning no more than 15 points and keeping its sign. Then the cliff was spare capacity all along and this is a model-larger-than-its-task effect rather than a small-model one.
Prior recorded in advance: good on the cliff flattening, because P11 found exactly that for the transfer head start. That prior was wrong.
Result: the kill test does not fire
| Width | Lag | Transition | Control samples to 0.9 | Oracle x0.8 | Fixed step |
|---|---|---|---|---|---|
| 32 | 4 | 117 | 17,472 [16,436, 18,508] | +26.8% | +26.5% |
| 48 | 6 | 125 | 39,488 [31,926, 47,050] | +3.5% | +3.5% |
| 96 | 8 | 134 | 69,248 [64,337, 74,159] | +13.8% | +13.0% |
| 192 | 11 | 166 | 74,176 [62,290, 86,062] | -35.7% | -33.5% |
Spans 62.4 points and still changes sign. The cliff survives difficulty matching.
This is the first fixed-task effect in this programme to survive a matched ladder rather than dissolve on one, and that is worth saying plainly given how much of Bucket P went the other way.
But it is not monotone. +26.8, +3.5, +13.8, -35.7: the width-48 rung is well out of line, and its control interval is by far the widest in the table (31,926 to 47,050). Q12's sweep was monotone and this one is not, on the same manoeuvre and the same endpoint. So "the saving falls with width" is a description of Q12's ladder, not a law.
The parallel I am flagging rather than claiming
Q12's candidate mechanism was that the cut stops paying where extra width stops paying. The same shape appears here, at the same rung:
| Rung | Q12, control cost | Q13, control cost |
|---|---|---|
| first to second | 3.30x cheaper | 2.26x dearer |
| second to third | 1.64x cheaper | 1.75x dearer |
| third to fourth | 1.09x cheaper | 1.07x dearer |
In both sweeps the control's cost stops responding at the last rung, and in both sweeps that is exactly where the cut flips. Two readings fit: width 192 is genuinely different, or the last rung of both sweeps is where something else breaks.
I cannot tell those apart from this data, and Q8 is why I am saying so rather than picking one. Q8 had a pattern that fitted every point in a small grid, I preferred it over a preregistered kill test, and Q11 withdrew it the same day. A third rung between 96 and 192 would separate these; nothing here does.
There is also a concrete reason to distrust the last rung. The ladder was supposed to hold the transition constant and held it to a 36% spread: 117, 125, 134, then 166. The jump to 166 is the largest step in the sweep, so the width-192 cell is the least well matched of the four, and it is the one carrying the result. That cuts against my own conclusion and belongs in it.
The fixed-schedule arm, for the sixth time
Oracle minus fixed: +0.3, +0.0, +0.8, -2.2 points. Per-run timing buys nothing again, and at the rung where the manoeuvre fails the fixed step is the better of the two. That is K2's finding, Q1's, Q5's, Q11's, Q12's and now this one. Six independent tests, no exceptions. If any single claim in this bucket is safe to build on, it is that one.
What stands
- The batch cut's sign change is not explained by spare capacity, on this evidence. The preregistered kill test asked a clear question and got a clear answer.
- It is not a clean law either. Non-monotone, and the deciding cell is the worst-matched one.
- Per-run timing is worthless, six for six, which is now the most replicated result in the bucket.
Limits
- The ladder is loose where it matters most. A
36%transition spread, with the largest step landing on the cell that carries the verdict. - Four rungs, five seeds. The width-48 control interval spans
15,000samples, wide enough that its+3.5%should not be read as a real dip rather than noise. - One task family, one cut ratio, one multiple, one target, all inherited and fixed in advance.
- A uniform
3,000-step budget across the ladder, chosen so the hardest cell's control reaches the target. The easy rungs therefore run long after converging, which costs nothing on this endpoint and would matter on one normalised by run length (Q6). - The mechanism section above is a flag, not a finding. It has no kill test and it is not offered as one.
Terms on this page
Every piece of vocabulary this record uses, in plain language. Generated from the text above, so it cannot drift out of step with it.
- confound
- A second explanation you did not control for. If bigger models both learn faster and score higher, then 'fast learners score higher' may be entirely about size and not about speed.
- kill test
- A condition written down before running the experiment that says what result would make us abandon the idea. Fixing it in advance is what stops a disappointing result being reinterpreted as an encouraging one.
- seed
- The number that fixes all the randomness in a training run. Same seed, same run. Running several seeds is how you tell a real effect from a lucky one.
- width
- How many internal numbers a model uses at each layer. The usual way we vary model size in these experiments.
Get new results as we publish them
Roughly monthly, one finding per email, in plain English first. Including the approaches that turned out not to work, which are usually the useful ones. No sales email.
Double opt-in: we send a confirmation link and add nobody who does not click it. One-click unsubscribe on every email.