
Three Audits, No New Faults
Ongoing research. This is an experimental result from active work, not a settled conclusion. The numbers are what we measured and the method is described so you can judge it, but the programme is still running and later experiments may revise what it means.
A note on the language in these records. This is a working laboratory notebook for research into training AI models more cheaply and efficiently, so you will read that an approach did not work, that a result did not hold up, or that one method was worse than another. That is the research doing its job, not a verdict on the engineering we deliver to clients. Ruling an approach out is how the search narrows, and these are the pages that teach us the most: nearly every technique we now rely on came from understanding why something else fell short. Testing our own ideas at least as hard as anyone else's is the point of publishing them. More about this programme and why we run it.
Part of a bigger question: How do we know our own results are real? – Repeatedly, the control rather than the measurement decided the result -- and several striking findings dissolved when the right comparison was finally run.
In plain English
What we asked. An experiment that varies two things at once, always together, cannot tell you which of the two made the difference: every explanation agrees with the evidence. We had one experiment like that, found by accident. So we checked every experiment for it, by looking at which settings each one actually ran and whether any two always rose and fell together.
What we found. Eleven were flagged. Five were just reference tables, not experiments. Two were the case we already knew about and the claim it had been investigating. The other four moved two settings together deliberately, to scale a model and its task up in step, and all four said so rather than crediting one setting. No new cases.
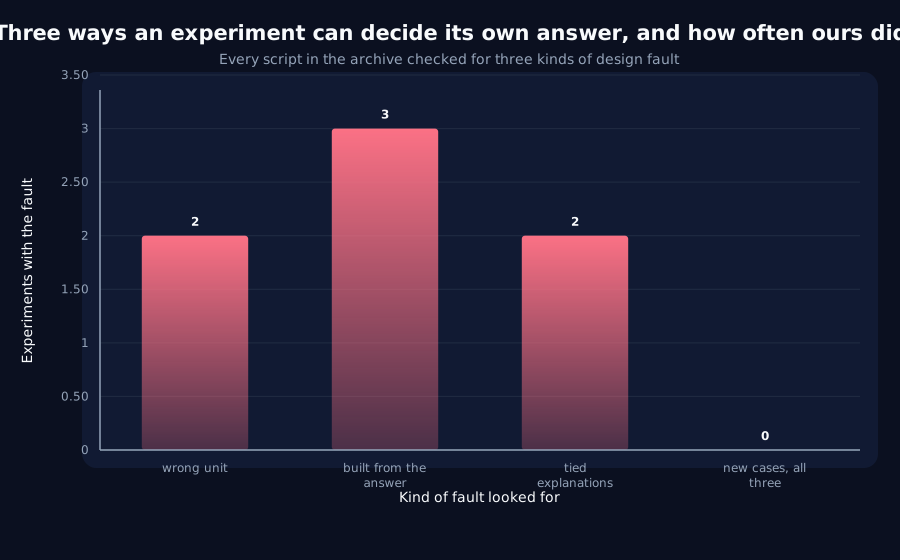
Why it matters. This is the third such check we have run, each for a different kind of design fault, and none found anything new. Every fault had already been caught, always at a point where an earlier design was reused for a new question. The honest reading is not that checking was unnecessary, since only checking could tell us that, but that the next check should look for a kind of fault none of these three covered.
The rest of this page is the technical record: the design, every number, and the limits. It is written for a reviewer, and you do not need it to have understood the result above.
New here? How to read a research record
- Start at the verdict. Every record states, before the experiment was run, what result would have made us abandon the idea. That is the "kill test". Then it says whether the test fired. Nothing gets reinterpreted after the fact.
- Numbers in square brackets are uncertainty.
23.4 [18.1, 28.7]means our best estimate is 23.4 and the true value is probably somewhere in that range. If a range includes zero, we cannot claim an effect. - Results that rule an idea out are kept. Roughly half of what is published here says an approach did not work, including plenty of our own. Those pages are the output, not a shortfall: knowing which direction is a dead end is what lets the next experiment go somewhere better, and most of what we now rely on came out of understanding why something else fell short. Work that only publishes what worked is not measuring anything.
- Read the Limits section. Every record ends with what it does not show. It is the most honest part of any experiment and usually the shortest.
- Pro tip: the figures near the top are designed to carry the result on their own. If you read nothing else, read the caption under each one, which says what it shows and what to take from it.
EXPLORATORY. Not a preregistered study. No training. Reads committed pilots and outputs in about a second. The kill test is the one R14 wrote on 2026-09-26.
Program v2 Bucket R, item R16. Decisive computation: analysis/tied_grid_audit.pyanalysis/tied_grid_audit.jsonpython analysis/tied_grid_audit.py.
The question
R14 audited designs built from the quantity they then test, and found the three known cases and nothing else. It could count Q8's fault but not find its like, because Q8's fault was not a derived constant. Q8 ran a grid in which width and side-of-the-transition moved together, so every rival explanation agreed on the evidence that existed; Q11 untied them and the answer was width.
A tied grid is findable mechanically, from the cells a pilot actually ran. And of R14's three fault types, this is the one that arises in a fresh design rather than at reuse, so it is the least protected by the house conventions R14 and R15 credited.
Kill test, fixed before execution: fewer than three records other than Q8 attribute an effect to one of two factors their grid ties together.
Prior recorded in advance: low.
Design
Two scans, because grids live in two places:
- Literal grids in pilots -- module-level number-to-number tables (a ladder
{width: lag}or a lookup table), families of ladders as P11 keeps them, and lists of cells. - Cells actually run, from committed outputs -- every list of run records carrying two or more numeric design factors, reduced to its distinct cells. This sees grids built in code, which the first scan cannot.
A pair of factors with rank correlation at least 0.9 in magnitude across cells is tied. Every flagged pilot is read and classified in the script: ATTRIBUTES (a new case: the record assigns an effect to one of the tied factors), JOINT (it describes the tied path as joint, or declines to attribute), KNOWN (Q8, or the claim Q8 was investigating), NOT_A_GRID (a lookup table).
Result: the kill test fires
141 pilots and 124 outputs scanned; 11 flagged.
| Verdict | Pilots | Which |
|---|---|---|
NOT_A_GRID | 5 | t-critical and critical-value tables, and a table transcribed for a figure |
KNOWN | 2 | Q8 itself; and Q1, whose attribution of the batch cut's reversal to width is the claim Q8 investigated and Q11 settled |
JOINT | 4 | P11's matched ladder and three records run on it (P12's first and third cases, Q13) |
ATTRIBUTES | 0 |
No record newly attributes an effect to one of two tied factors. The four JOINT records all use the matched ladder, where width and difficulty rise together by design -- that is what matching means -- and each describes the result as joint scaling ("bigger models once the task keeps pace"), isolates a third factor at fixed width and lag (P12's first case changed run length alone), or, in Q13's case, says in its own title that it is not claiming why.
What three audits of the archive now say
| Audit | Fault looked for | New cases |
|---|---|---|
| R15 | an interval over a unit that was not varied | 0 |
| R14 | a design derived from the quantity under test | 0 |
| R16 | a grid that ties two explanations | 0 |
Every fault these audits looked for exists here, and every instance was already known. The priors were wrong for R15 and R14 and right for R16, and the reason is the same in all three: the faults cluster at the points where a design is reused for a new question or leaves a house convention on purpose (R5 and P8's shared donor, R9's reused ladder, Q1's width attribution on a tied grid), and those points were exactly where the programme found them, by accident, before any audit ran. The audits did not find new faults; they measured that the accidental checking had been more complete than anyone had reason to believe.
What stands
- The kill test fires. Zero new records attribute an effect to one of two tied factors; the only tied grids are the two known cases and four matched-ladder records that describe the path as joint.
- Three archive audits, three fault types, zero new cases. The practical reading is not "audits are unnecessary" -- they are the only way to know this -- but "spend the next audit on a fault type none of the three covered".
Limits
- Factors are found by name. A grid whose cells are labelled only by strings (
"w48-lag6") or whose factors use names outside the audited set is invisible to the output scan; the literal scan catches the matched ladders, which are the ones that matter most here. - A tie is a rank correlation of
0.9. A partial tie -- two factors correlated at0.7across a small grid -- can still let rival explanations agree on most of the evidence, and is not audited. JOINTis a reading of each record's prose, one line per record, in the script.
Terms on this page
Every piece of vocabulary this record uses, in plain language. Generated from the text above, so it cannot drift out of step with it.
- kill test
- A condition written down before running the experiment that says what result would make us abandon the idea. Fixing it in advance is what stops a disappointing result being reinterpreted as an encouraging one.
- rank
- How many independent directions a set of numbers really uses. A low-rank structure is one that looks high-dimensional but is actually simple underneath.
- settled
- A run has settled when it has stopped improving. Measurements anchored to a run's own best score are unreliable until it has, because that best score is still moving.
- width
- How many internal numbers a model uses at each layer. The usual way we vary model size in these experiments.
Get new results as we publish them
Roughly monthly, one finding per email, in plain English first. Including the approaches that turned out not to work, which are usually the useful ones. No sales email.
Double opt-in: we send a confirmation link and add nobody who does not click it. One-click unsubscribe on every email.