
How Many of Our Results Are Close Calls
Ongoing research. This is an experimental result from active work, not a settled conclusion. The numbers are what we measured and the method is described so you can judge it, but the programme is still running and later experiments may revise what it means.
A note on the language in these records. This is a working laboratory notebook for research into training AI models more cheaply and efficiently, so you will read that an approach did not work, that a result did not hold up, or that one method was worse than another. That is the research doing its job, not a verdict on the engineering we deliver to clients. Ruling an approach out is how the search narrows, and these are the pages that teach us the most: nearly every technique we now rely on came from understanding why something else fell short. Testing our own ideas at least as hard as anyone else's is the point of publishing them. More about this programme and why we run it.
Part of a bigger question: How do we know our own results are real? – Repeatedly, the control rather than the measurement decided the result -- and several striking findings dissolved when the right comparison was finally run.
In plain English
What we asked. Every result we publish comes with an error bar, and the verdict comes from whether that bar clears a line we set in advance. One of our recent results was overturned for an uninteresting reason: we simply ran it more times. Its error bar had missed the line by about four hundredths of its own width, and running four times as many repetitions gives an error bar half the size, which was more than enough to move it.
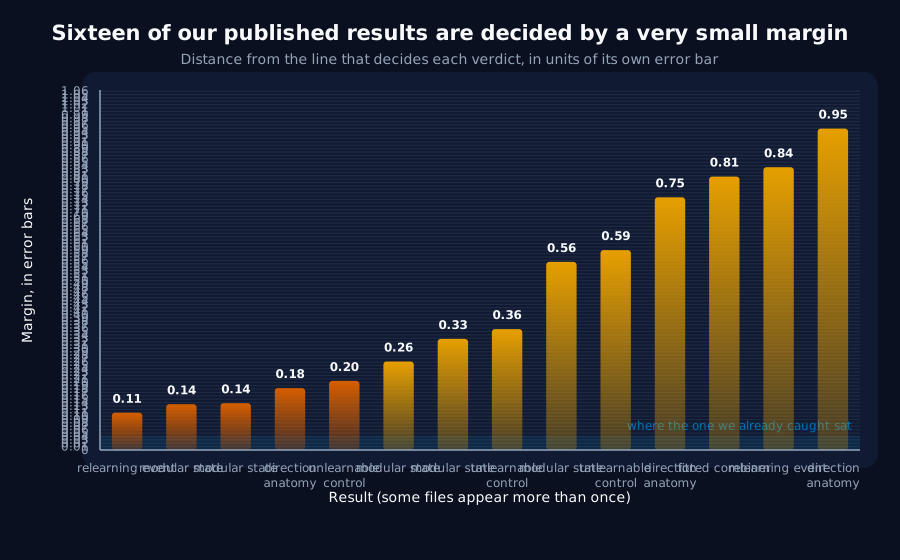
What we found. That made us ask an uncomfortable question about everything else we have published. So we measured, for every result in this project, how far its error bar sits from the line that decides it. Sixteen results across five studies are within one error bar of their own verdict, and the closest one is nearer than the result that already flipped. We are publishing that list, including which of our own headline findings is at the top of it.
Why it matters. Two things to be clear about. Being on this list does not make a result wrong. It means more computer time could move it, and it could move either way: the one we already caught moved toward the effect being real, not away from it. And the tool we built for this was itself wrong the first time, in a way worth admitting: it measured the wrong edge of the error bar, and confidently ranked one of our most solid results as our shakiest. We caught it because the answer disagreed with what we knew about that particular result. A measurement that answers a slightly different question than the one you asked is worse than no measurement, because it looks precise while being wrong.
The rest of this page is the technical record: the design, every number, and the limits. It is written for a reviewer, and you do not need it to have understood the result above.
New here? How to read a research record
- Start at the verdict. Every record states, before the experiment was run, what result would have made us abandon the idea. That is the "kill test". Then it says whether the test fired. Nothing gets reinterpreted after the fact.
- Numbers in square brackets are uncertainty.
23.4 [18.1, 28.7]means our best estimate is 23.4 and the true value is probably somewhere in that range. If a range includes zero, we cannot claim an effect. - Results that rule an idea out are kept. Roughly half of what is published here says an approach did not work, including plenty of our own. Those pages are the output, not a shortfall: knowing which direction is a dead end is what lets the next experiment go somewhere better, and most of what we now rely on came out of understanding why something else fell short. Work that only publishes what worked is not measuring anything.
- Read the Limits section. Every record ends with what it does not show. It is the most honest part of any experiment and usually the shortest.
- Pro tip: the figures near the top are designed to carry the result on their own. If you read nothing else, read the caption under each one, which says what it shows and what to take from it.
EXPLORATORY. Not a preregistered study. Archive-only, no training at all, no GPU, no cost.
Program v2 Bucket J, item J1. Decisive computation: analysis/power_audit.pyanalysis/power_audit.jsonpython analysis/power_audit.py, reading only committed pilot outputs.
The question
I3 reported two confident readings on six seeds and both were wrong. Its paired interval was +0.0113 [-0.0005, +0.0231]: the deciding bound sat 0.0005 from zero against a half-width of 0.0118, so it missed its boundary by 0.042 half-widths. Eighteen more seeds moved it to +0.0077 [+0.0033, +0.0121] and the verdict reversed.
That is not bad luck, it is arithmetic. A 95% interval's half-width shrinks roughly as 1/sqrt(n), so quadrupling the seeds halves it. Any interval whose deciding bound sits within about one half-width of its line is a candidate to move on nothing but compute.
This programme has 36 committed pilot outputs and most ran 5 to 10 seeds. How many are sitting that close?
Kill test: no published interval sits within one half-width of its decision boundary. Then I3 was isolated and the record's sample sizes are adequate.
Result: sixteen, across five files
| File | Fragile intervals | Closest |
|---|---|---|
relearning_event (E7) | 4 | 0.060 half-widths from 0 |
modular_state (E8) | 5 | 0.135 from 0.05 |
direction_anatomy (I3) | 3 | 0.183 from 0.05 |
unlearnable_control (I6) | 3 | 0.204 from 0 |
fitted_combiner (I4) | 1 | 0.807 from 0 |
The most fragile is E7's frozen-frame paired endpoint, +0.0158 [+0.0009, +0.0307], clearing zero by 0.060 half-widths, against I3's 0.042 before it reversed. That endpoint decides the "real by the intervals" half of E7's letter-versus-intent verdict, so it is the first thing J2 should re-run.
Two readings that are not in danger, and worth saying so explicitly:
- I3's own paired difference is now at
0.746half-widths on 24 seeds: comfortable, which is what adding seeds bought. - E7's materiality verdict is secure. Its low bound sits two full half-widths below the
0.05floor, so "the expansion recurs but is immaterial" is not at risk. Only the "recurs at all" half is.
The scan's own first version was wrong, and that is the transferable part
The first version scored each interval by whichever bound sat nearer the boundary. It ranked E7's headline as maximally fragile, 0.000 half-widths, because E7's high bound lands on 0.05 exactly.
That is precisely backwards. E7's verdict is decided by its low bound of 0.0143, which is two full half-widths from the floor: one of the most secure nulls in the record, scored as its most precarious.
Every decision rule in this programme is one-sided and of the same form: an effect counts when the interval's low bound clears the line. "Material" is low > 0.05; "clears zero" is low > 0. So the flip distance is always the low bound's distance from the boundary. The corrected metric changes the ranking entirely, and E7 stays at the top for a different and real reason.
A metric that answers a different question than the rule does is worse than no metric, because it is confidently wrong in a way that looks quantitative.
Verdict
- The kill test fails. 16 intervals across 5 files sit within one half-width of a decision boundary. I3 was not isolated.
- This is a triage list, not a list of errors. Many entries are intermediate values no headline rests on. Reading them is the next step, and J2 does that in flip-risk order.
- A fragile interval is not a wrong one. It means the verdict is decided by a margin four times the seeds would erase, in either direction. I3 flipped toward its effect being real.
- The cheapest structural fix is not more analysis, it is more seeds on fewer claims. Five to eight seeds is enough to find an effect and not enough to decide a marginal one.
Limits
- The scan does not know each record's boundary. It tests the two this programme uses,
0and the0.05materiality floor. An endpoint judged against something else is scored against the wrong line and has to be discarded by eye. - It cannot tell a headline from an intermediate value. Path names are reported so a reader can, but the ranking treats them alike.
- Intervals wider than
5.0are excluded as almost certainly not on a normalised endpoint, which is a crude filter. - The
1/sqrt(n)argument assumes the estimator is well behaved. For a skewed sample like I3's it is a rule of thumb, not a guarantee, and the honest statement is "could move", never "will". - This audits precision, not correctness. An interval can be comfortably clear of its boundary and still be measuring the wrong thing, which is what four of this programme's corrections have actually been.
Terms on this page
Every piece of vocabulary this record uses, in plain language. Generated from the text above, so it cannot drift out of step with it.
- kill test
- A condition written down before running the experiment that says what result would make us abandon the idea. Fixing it in advance is what stops a disappointing result being reinterpreted as an encouraging one.
- seed
- The number that fixes all the randomness in a training run. Same seed, same run. Running several seeds is how you tell a real effect from a lucky one.
- width
- How many internal numbers a model uses at each layer. The usual way we vary model size in these experiments.
Get new results as we publish them
Roughly monthly, one finding per email, in plain English first. Including the approaches that turned out not to work, which are usually the useful ones. No sales email.
Double opt-in: we send a confirmation link and add nobody who does not click it. One-click unsubscribe on every email.