
We Read Our Own Warning List
Ongoing research. This is an experimental result from active work, not a settled conclusion. The numbers are what we measured and the method is described so you can judge it, but the programme is still running and later experiments may revise what it means.
A note on the language in these records. This is a working laboratory notebook for research into training AI models more cheaply and efficiently, so you will read that an approach did not work, that a result did not hold up, or that one method was worse than another. That is the research doing its job, not a verdict on the engineering we deliver to clients. Ruling an approach out is how the search narrows, and these are the pages that teach us the most: nearly every technique we now rely on came from understanding why something else fell short. Testing our own ideas at least as hard as anyone else's is the point of publishing them. More about this programme and why we run it.
Part of a bigger question: How do we know our own results are real? – Repeatedly, the control rather than the measurement decided the result -- and several striking findings dissolved when the right comparison was finally run.
In plain English
What we asked. We recently had a result overturned simply by running it more times, so we built a tool to find every other result of ours that was decided by a similarly small margin. It flagged sixteen. That sounded alarming, and the tool itself warned that it could not tell the difference between a headline finding and a minor number reported along the way. So we read all sixteen.
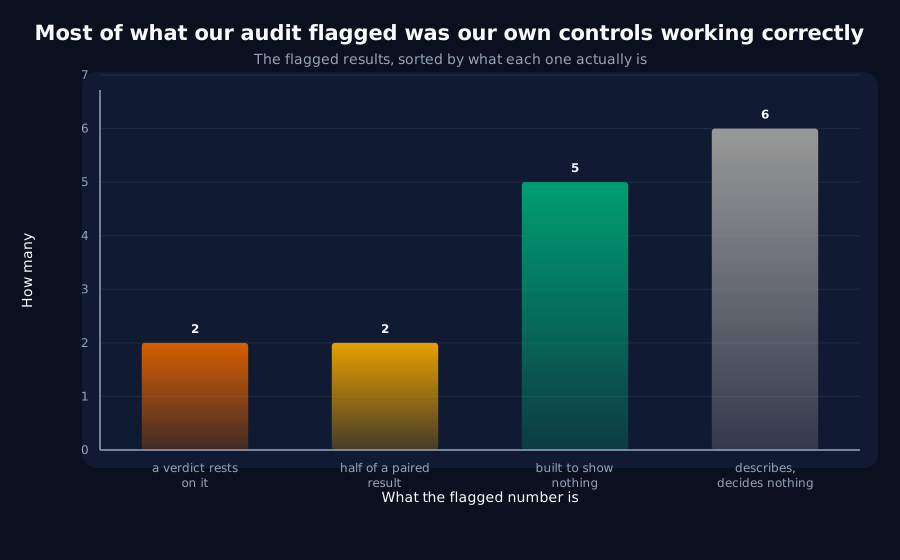
What we found. Only two were things a conclusion actually depends on, and we had already rechecked both by running them three times over. Five of them were our own comparison runs: experiments we set up deliberately so that nothing should happen in them. A comparison like that produces a number sitting on zero, and sitting on zero is exactly what our tool calls a close call. So the more carefully a study is controlled, the shakier the tool makes it look. Its ranking of which studies to worry about is close to backwards.
Why it matters. One study was flagged as our second most worrying on the strength of five numbers, none of which its conclusion uses; that conclusion rests on a comparison the tool never examined. And the two real cases have settled into a different kind of statement than we expected. After running them three times over they are still close calls, which no longer means we looked at them too briefly. It means the effects are genuinely small, and measured accurately. Those are different problems needing different responses, and the original tool could not tell them apart. We are keeping the tool, because it did find the one result worth rechecking, but we are recording plainly that we would have believed its ranking if we had not read the list.
The rest of this page is the technical record: the design, every number, and the limits. It is written for a reviewer, and you do not need it to have understood the result above.
New here? How to read a research record
- Start at the verdict. Every record states, before the experiment was run, what result would have made us abandon the idea. That is the "kill test". Then it says whether the test fired. Nothing gets reinterpreted after the fact.
- Numbers in square brackets are uncertainty.
23.4 [18.1, 28.7]means our best estimate is 23.4 and the true value is probably somewhere in that range. If a range includes zero, we cannot claim an effect. - Results that rule an idea out are kept. Roughly half of what is published here says an approach did not work, including plenty of our own. Those pages are the output, not a shortfall: knowing which direction is a dead end is what lets the next experiment go somewhere better, and most of what we now rely on came out of understanding why something else fell short. Work that only publishes what worked is not measuring anything.
- Read the Limits section. Every record ends with what it does not show. It is the most honest part of any experiment and usually the shortest.
- Pro tip: the figures near the top are designed to carry the result on their own. If you read nothing else, read the caption under each one, which says what it shows and what to take from it.
EXPLORATORY. Not a preregistered study. 48 training runs (E7 at 24 seeds) plus an archive-only re-read, no GPU, no cost.
Program v2 Bucket J, item J2. Decisive computation: analysis/power_audit.pyROLES and RESAMPLED tables) and analysis/relearning_event.pyanalysis/power_audit.jsonanalysis/relearning_event.json
The question
J1 found 16 published intervals within one half-width of the line that decides them and said, in its own Limits, that it "cannot tell a headline from an intermediate value" and that reading them is the next step. This is that step, plus the re-run of the worst case.
Kill test: every fragile headline survives at 24 seeds.
Part one: E7, the most fragile of all, survives
J1 ranked E7's frozen-frame paired endpoint first, clearing zero by 0.060 half-widths against I3's 0.042 before that record reversed. Re-run at 24 seeds:
| Endpoint | 8 seeds | 24 seeds | Margin |
|---|---|---|---|
| swap, moving frame | +0.0322 [+0.0143, +0.0500] | +0.0329 [+0.0255, +0.0403] | 0.80 → 3.45 |
| swap, frozen frame | +0.0158 [+0.0009, +0.0307] | +0.0145 [+0.0072, +0.0219] | 0.06 → 0.99 |
24 of 24 swapped runs produce a second learning event; 0 of 24 controls do. Nothing in E7's verdict changes, and its "immaterial" half is now more secure than before.
The contrast with I3 is diagnosable in advance, and is the reusable part:
| I3 (reversed) | E7 (survived) | |
|---|---|---|
| point estimate on 3x the seeds | moved a lot (1.66x → 1.02x) | barely moved (+0.0158 → +0.0145) |
| what was actually wrong | the discovery sample was biased: a pattern noticed in the data, then tested on that same data | nothing; it was merely imprecise |
A fragile interval with a stable point estimate is underpowered. One found by noticing a pattern is a different and worse problem. Re-run the ones that were found by looking, first.
Part two: reading the sixteen changes J1's picture
Every flagged interval was read against its own record's stated endpoint, and the classification is recorded in the script as a table rather than in prose, so it can be argued with:
| Role | Count | What it is |
|---|---|---|
| headline | 2 | the endpoint a verdict actually rests on |
| control | 5 | an arm built to show nothing |
| component | 2 | an unpaired half of a paired endpoint |
| intermediate | 6 | a descriptive value no verdict rests on |
Only two of the flagged intervals are endpoints anything rests on, I3's paired difference and E7's frozen-frame endpoint, and both have already been re-run at 24 seeds.
The scan systematically over-flags careful work
This is the finding, and it inverts J1's file-level ranking.
A control is built to be flat. A flat interval sits on zero. So a good control is always flagged as fragile, and a record with many careful controls is ranked as the most precarious in the programme. Five of the sixteen are the standing random-time-matched controls this programme requires in every geometry experiment; one is I4's overfitting diagnostic, where straddling zero is the desired outcome.
E8 is the clearest case. J1 ranked modular_state second with five fragile intervals, all of them per_block means. E8's verdict is a spread ratio, between-block spread over within-block seed spread, 1.02, plus an argmax consistency count. No per-block interval decides anything. Five of J1's sixteen were pointing at a record whose endpoint the scan never looked at.
And what remains is a statement about effect size, not power
Both surviving headlines are still within one half-width at 24 seeds (0.75 and 0.99). After quadrupling a sample, that is no longer a statement about how hard we looked. These are small effects, precisely estimated, and going to 96 seeds would tighten the interval without changing what it says.
That distinction, underpowered against small, is the one J1 could not make and this one can.
Verdict
- The kill test does not fire in the way J1 implied it would. Of 16 flagged intervals, 2 are headlines, both already re-run, both settled.
- E7 survives at 24 seeds and its verdict is unchanged.
- J1's file-level ranking is misleading and should not be used as a list of suspect records. It ranks by proximity to a boundary, which rewards having controls.
- The audit remains worth having: it caught E7 and forced the reading, but its output is a list of intervals to classify, never a list of records to distrust.
- The
ROLEStable is now the durable artifact, not the ranking: it is the record of which quantity each verdict actually rests on, which nothing in this programme had written down.
Limits
- The role classification is a judgement, not a measurement. It was made by reading each record's stated endpoint, and it is committed as a table so it can be disputed; a different reader could reasonably move a
componentto aheadline. - Only E7 was re-run. I3 was already at 24 seeds. Nothing else was, because nothing else needed it once the roles were read, which is itself a claim resting on the classification above.
- The
1/sqrt(n)argument remains a rule of thumb, and for a skewed sample it is a weak one. - This audits precision only. Four of this programme's corrections were to the analysis rather than the sample, and no interval-based scan would have caught any of them.
Terms on this page
Every piece of vocabulary this record uses, in plain language. Generated from the text above, so it cannot drift out of step with it.
- argmax
- Short for 'the argument that maximises'. A model outputs a score for every possible next token; the argmax is simply whichever one scored highest. Accuracy is measured on the argmax, which is why accuracy is a thresholded quantity: only the winner counts, and by how much it won is discarded.
- kill test
- A condition written down before running the experiment that says what result would make us abandon the idea. Fixing it in advance is what stops a disappointing result being reinterpreted as an encouraging one.
- overfitting
- When a model learns the training data specifically rather than the pattern behind it, and so does well in training and badly on anything new.
- rank
- How many independent directions a set of numbers really uses. A low-rank structure is one that looks high-dimensional but is actually simple underneath.
- seed
- The number that fixes all the randomness in a training run. Same seed, same run. Running several seeds is how you tell a real effect from a lucky one.
- settled
- A run has settled when it has stopped improving. Measurements anchored to a run's own best score are unreliable until it has, because that best score is still moving.
- width
- How many internal numbers a model uses at each layer. The usual way we vary model size in these experiments.
Get new results as we publish them
Roughly monthly, one finding per email, in plain English first. Including the approaches that turned out not to work, which are usually the useful ones. No sales email.
Double opt-in: we send a confirmation link and add nobody who does not click it. One-click unsubscribe on every email.