
Predicting The Cost From The Task
Ongoing research. This is an experimental result from active work, not a settled conclusion. The numbers are what we measured and the method is described so you can judge it, but the programme is still running and later experiments may revise what it means.
A note on the language in these records. This is a working laboratory notebook for research into training AI models more cheaply and efficiently, so you will read that an approach did not work, that a result did not hold up, or that one method was worse than another. That is the research doing its job, not a verdict on the engineering we deliver to clients. Ruling an approach out is how the search narrows, and these are the pages that teach us the most: nearly every technique we now rely on came from understanding why something else fell short. Testing our own ideas at least as hard as anyone else's is the point of publishing them. More about this programme and why we run it.
Part of a bigger question: Is the task we are studying actually hard? – Often it is not. A rule from 1990 with no parameters beats the trained model on the task most of these results were measured on, and what an intervention costs is set by the task's own structure.
In plain English
What we asked. In a previous experiment we denied a model each earlier word in turn and measured how much longer it then took to learn. Those costs fell into neat groups, and the groups lined up with the length of the repeating pattern in the exercise rather than with how far back the word sat. Words the same distance apart in the pattern cost the same to take away, even when one was much further back than the other. That was a striking observation and it was also, on one exercise, indistinguishable from a coincidence about the particular numbers involved.
What we found. So we changed the exercise. We ran the whole thing again with repeat lengths of three, four and five, and for each one we scored how cleanly the costs group under every possible grouping, not just the one we expected to win. That last part matters: a grouping that looks tidy is worth nothing if a wrong grouping looks equally tidy. The correct grouping won in every exercise, and every wrong grouping came out at about the value that means no grouping at all. Where the split was even, two words in the same group cost exactly the same to the decimal place.
Why it matters. This is the first thing we have found on this project that can be worked out from the exercise alone, without looking at the model. Everything else we publish measures what a model does; this says what the task itself dictates about the price of interfering with it. Two consequences are worth knowing. Taking away a word that holds no part of the current answer can cost more than taking away the word that *is* the answer, because a repeating exercise gives the model a spare copy of the answer to fall back on. And a few removals actually speed the model up, because they save it the work of learning to ignore a distraction. What we still cannot say is *which* group will turn out to be the expensive one -- that changes between exercises, and we do not yet know why.
The rest of this page is the technical record: the design, every number, and the limits. It is written for a reviewer, and you do not need it to have understood the result above.
New here? How to read a research record
- Start at the verdict. Every record states, before the experiment was run, what result would have made us abandon the idea. That is the "kill test". Then it says whether the test fired. Nothing gets reinterpreted after the fact.
- Numbers in square brackets are uncertainty.
23.4 [18.1, 28.7]means our best estimate is 23.4 and the true value is probably somewhere in that range. If a range includes zero, we cannot claim an effect. - Results that rule an idea out are kept. Roughly half of what is published here says an approach did not work, including plenty of our own. Those pages are the output, not a shortfall: knowing which direction is a dead end is what lets the next experiment go somewhere better, and most of what we now rely on came out of understanding why something else fell short. Work that only publishes what worked is not measuring anything.
- Read the Limits section. Every record ends with what it does not show. It is the most honest part of any experiment and usually the shortest.
- Pro tip: the figures near the top are designed to carry the result on their own. If you read nothing else, read the caption under each one, which says what it shows and what to take from it.
EXPLORATORY. Not a preregistered study. Local CPU, 108 training runs, no GPU, no cost.
Program v2 Bucket N, item N12. Decisive computation: analysis/cost_classes_move.pyanalysis/cost_classes_move.jsonpython analysis/cost_classes_move.py, or re-derive every endpoint with --reuse.
The question
N4 denied a model each earlier position in turn and found the costs cluster into clean pairs, lags 1 and 5 agreeing to 0.8 steps, lags 2 and 6 to 5.0, a between-class range of 53.3 against a within-class spread of 8.1, ratio 6.56. On delayed-copy at lag 4 those pairs are the residue classes modulo 4.
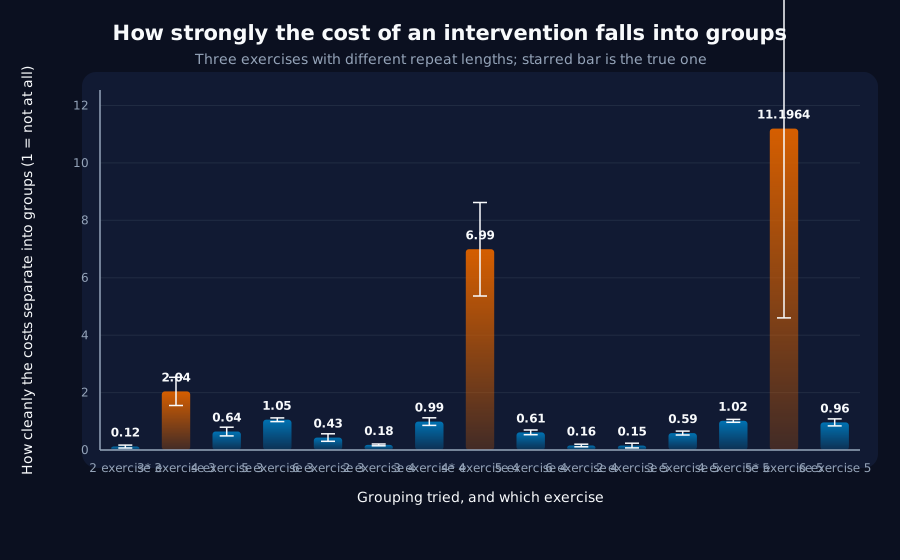
That reading was descriptive, and one task cannot tell it apart from a coincidence about the numbers 1 to 8. If the grouping is really about which prefix element a position carries, then changing the task's lag must move the classes with it.
Kill test, fixed in advance: the classes do not move with the lag.
The endpoint is a ranking, so no threshold can manufacture it. For each task lag the clustering ratio is computed under every candidate modulus, not only the true one. A ratio that is large under the true modulus but equally large under a wrong one says nothing; the true modulus has to win.
Result: the classes move, at every lag tested
| task lag | modulus 2 | modulus 3 | modulus 4 | modulus 5 | modulus 6 |
|---|---|---|---|---|---|
| 3 | 0.12 | 2.04 [1.55, 2.53] | 0.64 | 1.05 | 0.43 |
| 4 | 0.18 | 0.99 | 6.99 [5.36, 8.62] | 0.61 | 0.16 |
| 5 | 0.15 | 0.59 | 1.02 | 11.20 [4.60, 17.79] | 0.96 |
The task's own lag wins every row, and no runner-up interval overlaps the winner's: at lag 3 [1.55, 2.53] against [0.99, 1.12]; at lag 4 [5.36, 8.62] against [0.86, 1.12]; at lag 5 [4.60, 17.79] against [0.97, 1.07]. Every wrong modulus sits at or below 1.05, which is what "no clustering at all" looks like on this statistic.
The kill test does not fire. N4's anchor reproduced: its 6.56 sits inside the lag-4 interval [5.36, 8.62], on different seeds and with the sign convention imported rather than re-derived.
The maps
Mean delay in steps, by the position denied, grouped by residue class.
| task lag | class | positions and delays |
|---|---|---|
| 3 | 0 | lag 3 −18.8, lag 6 −23.8 |
| 3 | 1 | lag 1 +11.2, lag 4 +13.8, lag 7 +3.8 |
| 3 | 2 (the answer) | lag 2 +35.0, lag 5 +6.2, lag 8 −1.2 |
| 4 | 0 | lag 4 +3.8, lag 8 −11.2 |
| 4 | 1 | lag 1 +6.2, lag 5 +6.2 |
| 4 | 2 | lag 2 +47.5, lag 6 +52.5 |
| 4 | 3 (the answer) | lag 3 +30.0, lag 7 +18.8 |
| 5 | 1 | lag 1 +2.5, lag 6 +2.5 |
| 5 | 2 | lag 2 +30.0, lag 7 +31.2 |
| 5 | 3 | lag 3 +82.5, lag 8 +62.5 |
At lag 4 the class-1 pair is identical to the decimal place; at lag 5 so is its class-1 pair, and its class-2 pair agrees to 1.2 steps. Positions the same distance apart in the task's own periodic structure cost the same thing to remove, however far back they sit.
What is weaker, and it is the lag-3 row
Lag 3's ratio is 2.04 against lag 4's 6.99 and lag 5's 11.20, and its classes are visibly noisier, class 2 spans +35.0 to −1.2. The verdict there rests on a clear but much smaller margin. Two readings are available and this record cannot separate them: shorter lags make an easier task, so blocking any one position matters less; or three classes over eight positions gives an uneven 3/3/2 split where four classes over eight gives a clean 2/2/2/2. The trend is that the effect strengthens with lag, on three points.
What this establishes
The cost of an intervention is predictable from the task's structure alone, without reference to the model, the run, or which position happens to be involved. That is the first result in this programme with that shape: everything else here measures what a model does, and this measures what the task dictates about what doing something to the model will cost.
Two consequences carried over from N4 and now known to be structural rather than incidental: denying a class that carries no part of the current answer can cost more than denying the class that is the answer (lag 4: +49.2 against +23.3), because a periodic task supplies more than one copy of its answer; and denying some classes accelerates training, lag 3's class 0 by −18.8 and −23.8 steps, lag 4's lag 8 by −11.2.
It does not explain why one class is the expensive one. The measurement says cost is a function of residue; it does not say which residue will be costly, and the ordering is not the same across lags. That is the next question and it is a genuinely open one.
Verdict
- The kill test does not fire. The true modulus wins at all three task lags, with no runner-up interval overlapping and every wrong modulus at or below
1.05. - N4's anchor reproduced on different seeds.
- The effect strengthens with lag,
2.04,6.99,11.20, on three points. - Within-class agreement is exact where the split is even:
+6.2/+6.2at lag 4,+2.5/+2.5at lag 5. - Which residue is expensive is not predicted, only that cost is a function of residue.
Limits
- Four seeds per cell, three task lags, one width, one learning rate, one block window and strength. The window (
100steps) and strength (10.0) are N4's and were not swept. - Three points is a trend, not a law. "Strengthens with lag" is a description of
2.04,6.99,11.20, and lags 6 and above are untested. - The class split is uneven at some lags. Over positions 1 to 8, lag 3 gives 3/3/2 and lag 5 gives 2/2/2/1/1, and classes with one member are excluded from the ratio by construction. That is a defensible rule but it means the lags are not compared on identical footing.
- One task family.
delayed-copyis periodic by construction, which is exactly what makes residue classes meaningful. Nothing here says the result generalises to a task without that structure, and M1 showed this task is solved outright by a lookup. - The intervention is on the training objective, not on the architecture or the data, so "cost" means "delay to the accuracy midpoint under this particular block".
- Why a given residue is costly is unexplained, and the ordering differs between lags, so the obvious story: that the expensive class is the one needed soonest, is not supported by these three maps.
Terms on this page
Every piece of vocabulary this record uses, in plain language. Generated from the text above, so it cannot drift out of step with it.
- accuracy
- The fraction of answers a model gets right on questions it was not trained on.
- architecture
- The blueprint of a model: what components it has and how they connect. Two models can be the same size and completely different architectures.
- kill test
- A condition written down before running the experiment that says what result would make us abandon the idea. Fixing it in advance is what stops a disappointing result being reinterpreted as an encouraging one.
- learning rate
- How big a step training takes each time it updates the model. Too small and nothing happens; too big and it never settles.
- seed
- The number that fixes all the randomness in a training run. Same seed, same run. Running several seeds is how you tell a real effect from a lucky one.
- width
- How many internal numbers a model uses at each layer. The usual way we vary model size in these experiments.
Get new results as we publish them
Roughly monthly, one finding per email, in plain English first. Including the approaches that turned out not to work, which are usually the useful ones. No sales email.
Double opt-in: we send a confirmation link and add nobody who does not click it. One-click unsubscribe on every email.