
A Rule From 1990
Ongoing research. This is an experimental result from active work, not a settled conclusion. The numbers are what we measured and the method is described so you can judge it, but the programme is still running and later experiments may revise what it means.
A note on the language in these records. This is a working laboratory notebook for research into training AI models more cheaply and efficiently, so you will read that an approach did not work, that a result did not hold up, or that one method was worse than another. That is the research doing its job, not a verdict on the engineering we deliver to clients. Ruling an approach out is how the search narrows, and these are the pages that teach us the most: nearly every technique we now rely on came from understanding why something else fell short. Testing our own ideas at least as hard as anyone else's is the point of publishing them. More about this programme and why we run it.
Part of a bigger question: Is the task we are studying actually hard? – Often it is not. A rule from 1990 with no parameters beats the trained model on the task most of these results were measured on, and what an intervention costs is set by the task's own structure.
In plain English
What we asked. A rule we keep coming back to on this project is that any clever thing has to be measured against the dullest thing that would also work. We had applied it to the techniques we were testing, to the warning signals we built, and to the instruments that read them. We had never applied it to the exercise itself. Almost everything we have published was measured on one small task, and nobody had asked what a predictor from before neural language models existed would score on it.
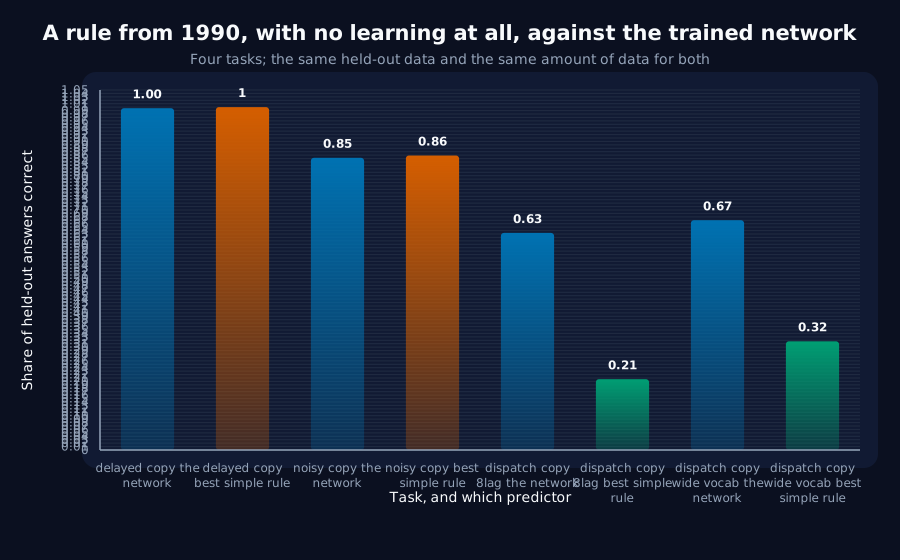
What we found. The answer is that it scores perfectly. The rule is to repeat whatever word appeared a fixed number of places earlier, and we made it work out that distance from the training data rather than telling it. It has no parameters, needs no training, and gets every held-out answer right, while the trained network gets 99.7% and never quite catches up even after two thousand rounds of training. On a second task the same rule matches the network too.
Why it matters. This does not make any of our results wrong. Every measurement of what the network does while it learns is still a measurement of exactly that. What changes is what the results are about: the network is rediscovering something that could have been written down, so our work is about how learning finds a known simple answer rather than about a network doing something nothing simpler can. Two newer tasks we added last year pass the same test comfortably, and that is the practical lesson worth taking: if you are choosing a benchmark, run the dullest possible method on it first. It takes minutes and it tells you whether the benchmark is measuring what you think.
The rest of this page is the technical record: the design, every number, and the limits. It is written for a reviewer, and you do not need it to have understood the result above.
New here? How to read a research record
- Start at the verdict. Every record states, before the experiment was run, what result would have made us abandon the idea. That is the "kill test". Then it says whether the test fired. Nothing gets reinterpreted after the fact.
- Numbers in square brackets are uncertainty.
23.4 [18.1, 28.7]means our best estimate is 23.4 and the true value is probably somewhere in that range. If a range includes zero, we cannot claim an effect. - Results that rule an idea out are kept. Roughly half of what is published here says an approach did not work, including plenty of our own. Those pages are the output, not a shortfall: knowing which direction is a dead end is what lets the next experiment go somewhere better, and most of what we now rely on came out of understanding why something else fell short. Work that only publishes what worked is not measuring anything.
- Read the Limits section. Every record ends with what it does not show. It is the most honest part of any experiment and usually the shortest.
- Pro tip: the figures near the top are designed to carry the result on their own. If you read nothing else, read the caption under each one, which says what it shows and what to take from it.
EXPLORATORY. Not a preregistered study. Local CPU, 12 training runs plus four counting baselines per task, no GPU, no cost.
Program v2 Bucket M, item M1. Decisive computation: analysis/classical_baselines.pyanalysis/classical_baselines.jsonpython analysis/classical_baselines.py, or re-score the classical arms with --reuse.
The question
The rule this programme repeats more than any other is "price every claim against the cheapest ordinary alternative". It has been applied to interventions, program v1 closed because plain fine-tuning won. It has been applied to detectors, where K2 found a single fixed step matched an oracle-timed one. It has been applied to instruments, where J7 found a probe costing thirteen times what it saved.
It has never been applied to the task. Fifty-five records characterise a learning transition on synthetic-delayed-copy-v1 and on E1's battery, and nobody had asked what a bigram, a Katz-backoff n-gram or a Kuhn and De Mori cache scores on the same held-out data.
Kill test, fixed in advance: no classical model gets within 20% of the GRU's final accuracy on any task in the battery.
Design
Every arm sees the same tokens: 2,000 × 64 = 128,000 sequences, the GRU's exact data budget, is scored on the same held-out batch, and is scored through the same mask. Nothing is handed the task's structure:
| arm | what it is |
|---|---|
unigram | the most frequent target, ignoring context |
bigram | the most frequent target given the current token |
backoff-N | Katz: the most frequent target given the last N tokens, backing off to N-1 and eventually to the unigram when a context was never seen |
cache-k | Kuhn and De Mori (1990): predict the token seen k positions back. k is fitted on the training data, never handed over |
One further arm, cache-dispatch, is handed the structure: it reads the announced lag out of position 0, and is reported as a diagnostic, excluded from the kill test.
Every GRU arm reproduced its published plateau from metrics.headroom (TASK_CEILINGS, measured 2026-08-22 by the E1 acceptance battery) at the same width, steps, batch and optimizer. Without that, none of the rows below would be about the configurations in question.
Result: the kill test fires on the task this programme is built on
| task | GRU, 2,000 steps | best classical | as a share of the GRU | kill test |
|---|---|---|---|---|
delayed-copy | 0.9969 [0.9927, 1.0011] | cache-3 1.0000 | 100.3% | FIRES |
noisy-copy | 0.8522 [0.8436, 0.8608] | cache-3 0.8589 | 100.8% | FIRES |
dispatch-copy-8lag | 0.6331 [0.6097, 0.6566] | cache-2 0.2065 | 32.6% | does not fire |
dispatch-copy-wide-vocab | 0.6702 [0.6479, 0.6924] | cache-2 0.3171 | 47.3% | does not fire |
synthetic-delayed-copy-v1 is solved exactly, and instantly, by a predictor with no parameters. The cache lag was fitted, not given: all three seeds picked k = 3, which is correct, from a range of ten candidates. The GRU never catches it within 2,000 steps. On the noisy variant the cache is at the analytic ceiling too.
That task carries the majority of this programme's records.
What it does not say
It does not invalidate anything. Every measurement in those records is a measurement of what a GRU does while learning that task, and remains one. What changes is the frame: the transition this programme has spent a year characterising is a network rediscovering a lookup table it could have been handed. That makes the phenomenon a study of how gradient descent finds a known simple algorithm, which is a real question, rather than a study of a network doing something no simpler thing can do.
E1's battery survives the same test, and that is the other half of the result. No unaided classical arm gets past 47% of the GRU on either dispatch task. The battery was built for headroom, not for this, and it turns out to be the part of the substrate that is doing work a lookup cannot.
But the diagnostic arm reframes what "headroom" means there. cache-dispatch, a cache told to read the announced lag, scores 1.0000 on both dispatch tasks. So:
- the gap on those tasks is entirely about dispatch, not about lookup. A model that can read the announcement and use it as an offset solves them outright;
- the true achievable ceiling on both is
1.0, not the0.6175and0.6696recorded inTASK_CEILINGS. Those plateaus are a GRU's limit, not a task's, and E2's headroom fractions are computed against them. This does not make any published headroom number wrong, the plateau is what E2 defines the reference as, but "fraction of achievable headroom" reads differently now: the achievable part is measured against what this architecture reaches, not against what the task permits.
Backoff behaves as the 1987 literature says it does
backoff-4 is the only counting arm that gets anywhere: 0.3913 on delayed copy, 0.1809-0.1787 on the dispatch tasks, against ~0.03 for the bigram. That is exactly the expected shape, an order-4 context contains the answer on delayed copy whenever it has been seen, and with a 32-token vocabulary most order-4 contexts have not been seen even in 128,000 sequences, so most positions back off and land at chance. The classical failure mode here is data sparsity, which is the failure mode backoff was invented for. The cache model sidesteps it entirely by having no parameters to estimate.
Verdict
- The kill test fires on
delayed-copyandnoisy-copy. A zero-parameter cache model matches or beats a 17,280-parameter GRU trained for 2,000 steps, and the GRU never catches it. - It does not fire on either dispatch task, where the best unaided classical arm reaches
32.6%and47.3%of the GRU. E1's battery is doing work that a lookup cannot. cache-dispatchscores1.0000on both dispatch tasks, so their difficulty is dispatch, and their true ceiling is1.0rather than the measured GRU plateau.- All four anchors reproduced.
Limits
- Three seeds per task. Enough for the size of these differences, the smallest gap in the table is
0.2065against0.6331, and not enough for a small one. - The classical arms are argmax predictors, not distributions. They are scored on accuracy, which is what the kill test asks about; a perplexity comparison would need smoothing choices this does not make, and would be a different record.
- "The same data budget" is sequences, not compute. The counting arms make one pass and the GRU makes 2,000 gradient steps over the same sequences. That comparison favours the classical arm on cost by a wide margin, which is the point, but it is not a controlled compute match.
- Backoff was capped at order 4. A higher order would need either more data or real smoothing; with a 32-token vocabulary, order 5 has 33 million contexts and 128,000 sequences to fill them.
- Nothing here says the transition is uninteresting. A network finding a lookup table by gradient descent, sharply, at a reproducible moment, is still the thing the other fifty-five records measure. It says the task is not evidence of difficulty.
Terms on this page
Every piece of vocabulary this record uses, in plain language. Generated from the text above, so it cannot drift out of step with it.
- accuracy
- The fraction of answers a model gets right on questions it was not trained on.
- architecture
- The blueprint of a model: what components it has and how they connect. Two models can be the same size and completely different architectures.
- argmax
- Short for 'the argument that maximises'. A model outputs a score for every possible next token; the argmax is simply whichever one scored highest. Accuracy is measured on the argmax, which is why accuracy is a thresholded quantity: only the winner counts, and by how much it won is discarded.
- baseline
- The thing you compare against. A result without one is not a result.
- fine-tuning
- Continuing to train an already-trained model on a new, usually narrower, task.
- gradient
- The direction and amount by which each of a model's internal numbers should change to do slightly better. Training is repeatedly following it.
- GRU
- Gated Recurrent Unit. A compact design for processing sequences one item at a time, with internal switches controlling what it keeps in memory.
- held-out
- Data the model was never trained on, kept back specifically to test it. Scoring a model on data it has already seen measures memorisation, not learning.
- kill test
- A condition written down before running the experiment that says what result would make us abandon the idea. Fixing it in advance is what stops a disappointing result being reinterpreted as an encouraging one.
- optimizer
- The algorithm that decides how to change the model given the gradient. AdamW and SGD are two common choices and they behave differently.
- parameters
- The adjustable numbers inside a model. Training is the process of setting them. Model size is usually quoted as a count of these.
- plateau
- A stretch of training where the model is not visibly improving. Often, though not always, followed by a sudden jump.
- probe
- A small separate model trained to read information out of a bigger model's internals, used as a measuring instrument rather than as a product.
- reproducible
- Someone else running the same code on the same inputs gets the same numbers. Every result here is checked this way.
- seed
- The number that fixes all the randomness in a training run. Same seed, same run. Running several seeds is how you tell a real effect from a lucky one.
- vocabulary
- The set of distinct symbols a model can read and produce.
- width
- How many internal numbers a model uses at each layer. The usual way we vary model size in these experiments.
Get new results as we publish them
Roughly monthly, one finding per email, in plain English first. Including the approaches that turned out not to work, which are usually the useful ones. No sales email.
Double opt-in: we send a confirmation link and add nobody who does not click it. One-click unsubscribe on every email.