
The Frame Decides the Sign
Ongoing research. This is an experimental result from active work, not a settled conclusion. The numbers are what we measured and the method is described so you can judge it, but the programme is still running and later experiments may revise what it means.
A note on the language in these records. This is a working laboratory notebook for research into training AI models more cheaply and efficiently, so you will read that an approach did not work, that a result did not hold up, or that one method was worse than another. That is the research doing its job, not a verdict on the engineering we deliver to clients. Ruling an approach out is how the search narrows, and these are the pages that teach us the most: nearly every technique we now rely on came from understanding why something else fell short. Testing our own ideas at least as hard as anyone else's is the point of publishing them. More about this programme and why we run it.
Part of a bigger question: What actually happens at the moment a model learns? – It builds machinery rather than selecting it, working through the task in a reproducible order and trying a simpler wrong rule on the way. The visible training curve cannot tell you which is happening.
In plain English
What we asked. Small models visibly reorganise their internal state when they learn a task, and models handed a ready-made solution do not. We wondered whether bigger models skip the reorganisation because their starting state is already good enough.
What we found. We measured it at three sizes, making the task harder for bigger models so all three learned at about the same time. One standard way of measuring the reorganisation said it grows with size; the other said it shrinks. The idea is not established.
Why it matters. The lesson: when two reasonable rulers disagree about the direction of an effect, report both and do not build on either.
The rest of this page is the technical record: the design, every number, and the limits. It is written for a reviewer, and you do not need it to have understood the result above.
New here? How to read a research record
- Start at the verdict. Every record states, before the experiment was run, what result would have made us abandon the idea. That is the "kill test". Then it says whether the test fired. Nothing gets reinterpreted after the fact.
- Numbers in square brackets are uncertainty.
23.4 [18.1, 28.7]means our best estimate is 23.4 and the true value is probably somewhere in that range. If a range includes zero, we cannot claim an effect. - Results that rule an idea out are kept. Roughly half of what is published here says an approach did not work, including plenty of our own. Those pages are the output, not a shortfall: knowing which direction is a dead end is what lets the next experiment go somewhere better, and most of what we now rely on came out of understanding why something else fell short. Work that only publishes what worked is not measuring anything.
- Read the Limits section. Every record ends with what it does not show. It is the most honest part of any experiment and usually the shortest.
- Pro tip: the figures near the top are designed to carry the result on their own. If you read nothing else, read the caption under each one, which says what it shows and what to take from it.
EXPLORATORY. Not a preregistered study. Local CPU,54training runs (18donors,36measured) plus one anchor. The design, bias statement and kill test were committed (5e83625) before any run.
Program v2 Bucket L, item L1. Decisive computation: analysis/warm_start_width.pyanalysis/warm_start_width.jsonpython analysis/warm_start_width.py (about an hour on a throttled laptop CPU); --reuse re-derives every endpoint from the saved series.
The question
K7 found the representation expansion is present when a model builds its mechanism from scratch and largely absent when it is handed one. F3 says a wider untrained recurrence is already a better reservoir. L1's synthesis: a wide model may be warm-starting itself, fitting a readout to a recurrence good enough at birth rather than building a mechanism, so its expansion should shrink with width. If so, one mechanism would explain several of this programme's width results at once.
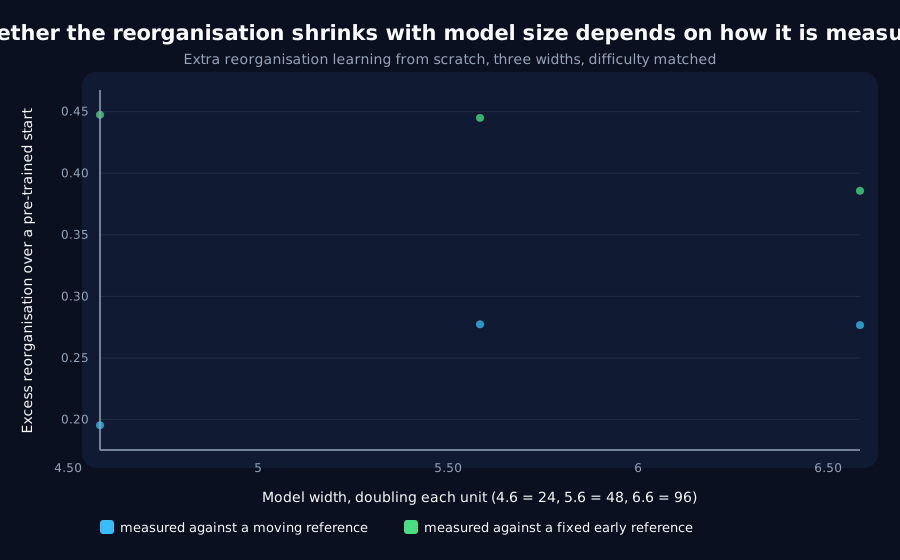
The sweep uses P11's difficulty-matched ladder (width 24/48/96 at lag 4/7/8), because a fixed-task width sweep manufactures the fade it reports. K7's harness, six seeds, 600 steps; per rung a scratch run and a warm-all run (every weight from a donor trained on the same rung, K7's no-event baseline). Endpoint: K7's best rise of the rank-8 residual, in both frames; compared across width as the excess, scratch minus warm-all on the same seed.
Kill test, fixed before execution: in both frames the per-seed slope of excess expansion on log2 width has an interval including zero. Anchor: K7's width-48 scratch run reproduces exactly. It holds. Bias stated in advance: a fixed top-8 basis leaves more directions outside it at larger width, pushing expansion up with width.
Result: the kill test does not fire, and the two frames disagree
| Excess expansion | Width 24 (lag 4) | Width 48 (lag 7) | Width 96 (lag 8) | Slope per doubling |
|---|---|---|---|---|
| Moving frame | +0.196 [+0.173, +0.218] | +0.277 [+0.262, +0.293] | +0.277 [+0.256, +0.297] | +0.041 [+0.027, +0.054] |
| Frozen frame | +0.447 [+0.418, +0.477] | +0.445 [+0.429, +0.461] | +0.386 [+0.378, +0.394] | -0.031 [-0.048, -0.014] |
The matched ladder held the scratch transition near 104-142 steps at every rung, as designed.
Neither slope interval includes zero, so the kill test does not fire. But the trend has opposite signs in the two frames. In the frozen frame (the basis fixed at step 10) the expansion is flat from width 24 to 48 and falls 13% at 96, the direction L1 predicted. In the moving frame it rises from 24 to 48 and stays there, the direction of the bias stated in advance.
What this does and does not support
- L1's synthesis gets at most weak support. "A wide model warm-starts itself" predicts the expansion falls with width. One frame shows a modest fall at the top rung only; the other shows a rise. That is not one mechanism explaining several width results.
- The frame decides the sign, which is D6's warning (the moving basis mixes rotation with expansion) seen across width for the first time here. Any width claim about this expansion has to name its frame, and neither frame alone is enough to carry L1's claim.
- The warm-all baseline is weaker than K7's: donors trained
600steps on the harder rungs start the warm-all arm at0.75-0.87accuracy rather than solved, so some real learning remains in the baseline.
What stands
- Kill test does not fire: both slopes exclude zero.
- The two frames give opposite trends with width (
+0.041moving,-0.031frozen per doubling). - L1's "wide models warm-start themselves" is not established; the frozen-frame fall is modest and confined to the widest rung.
Limits
- Three rungs, six seeds, one fixed analysis rank (
8) at every width. - Donors not fully converged on the harder rungs.
Terms on this page
Every piece of vocabulary this record uses, in plain language. Generated from the text above, so it cannot drift out of step with it.
- accuracy
- The fraction of answers a model gets right on questions it was not trained on.
- baseline
- The thing you compare against. A result without one is not a result.
- harness
- Everything wrapped around a model when it is used as an agent: its instructions, the tools it can call and how they are named, and how the conversation is laid out.
- kill test
- A condition written down before running the experiment that says what result would make us abandon the idea. Fixing it in advance is what stops a disappointing result being reinterpreted as an encouraging one.
- rank
- How many independent directions a set of numbers really uses. A low-rank structure is one that looks high-dimensional but is actually simple underneath.
- residual
- How far the data sits from a proposed description of it, after the description has been fitted as well as it can be. A small residual means the description accounts for what was measured; a large one means something is missing.
- seed
- The number that fixes all the randomness in a training run. Same seed, same run. Running several seeds is how you tell a real effect from a lucky one.
- slope
- How steeply one quantity changes as another does. A slope of one between a warning and the event it predicts means the warning shifts exactly in step with the event.
- width
- How many internal numbers a model uses at each layer. The usual way we vary model size in these experiments.
Get new results as we publish them
Roughly monthly, one finding per email, in plain English first. Including the approaches that turned out not to work, which are usually the useful ones. No sales email.
Double opt-in: we send a confirmation link and add nobody who does not click it. One-click unsubscribe on every email.