
The Measuring Grid Moves the Answer
Ongoing research. This is an experimental result from active work, not a settled conclusion. The numbers are what we measured and the method is described so you can judge it, but the programme is still running and later experiments may revise what it means.
A note on the language in these records. This is a working laboratory notebook for research into training AI models more cheaply and efficiently, so you will read that an approach did not work, that a result did not hold up, or that one method was worse than another. That is the research doing its job, not a verdict on the engineering we deliver to clients. Ruling an approach out is how the search narrows, and these are the pages that teach us the most: nearly every technique we now rely on came from understanding why something else fell short. Testing our own ideas at least as hard as anyone else's is the point of publishing them. More about this programme and why we run it.
Part of a bigger question: How do we know our own results are real? – Repeatedly, the control rather than the measurement decided the result -- and several striking findings dissolved when the right comparison was finally run.
In plain English
What we asked. The models we study improve suddenly rather than gradually, and we have a number for how sudden. That number underpins the only results we have about how these effects scale. It is computed by taking the biggest jump in a run and dividing by two things: how long the run was, and how many times we checked the model along the way. Neither of those is a fact about the model. They are choices made in the logging code.
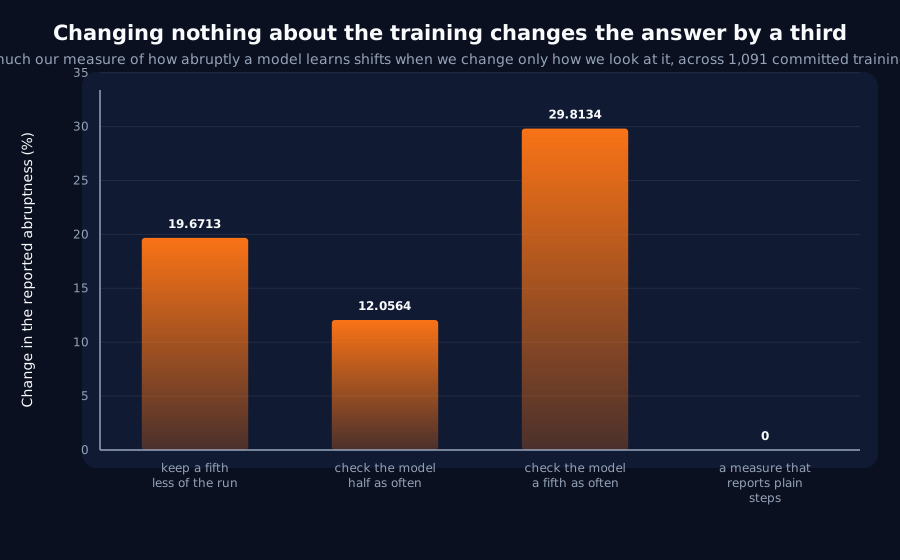
What we found. So we changed only those choices, on 1,091 saved runs, without retraining anything. Shortening the record by a fifth moved the answer by twenty per cent - and we had predicted exactly twenty per cent beforehand from the arithmetic, which is what makes it a test rather than an observation. The second axis was worse and nobody had looked at it: checking the model a fifth as often moves the answer by thirty per cent. That is exactly the difference between two of our own experiments that use this same measure. A different measure, which simply reports how many training steps the improvement took, does not move at all.
Why it matters. Nothing we have published is damaged by this, and the reason is the useful part. Every comparison in our archive happens between runs measured the same way, because an earlier result had already noticed the hazard and written down a warning not to compare across it. The warning was obeyed. What was missing was any sense of what it was worth - it turns out to be worth thirty per cent. The lesson worth copying: prefer a measurement that reports its answer in real units, like training steps, over one that divides by properties of the run. And when you suspect a number is an artefact, predict how big the artefact should be before you measure it.
The rest of this page is the technical record: the design, every number, and the limits. It is written for a reviewer, and you do not need it to have understood the result above.
New here? How to read a research record
- Start at the verdict. Every record states, before the experiment was run, what result would have made us abandon the idea. That is the "kill test". Then it says whether the test fired. Nothing gets reinterpreted after the fact.
- Numbers in square brackets are uncertainty.
23.4 [18.1, 28.7]means our best estimate is 23.4 and the true value is probably somewhere in that range. If a range includes zero, we cannot claim an effect. - Results that rule an idea out are kept. Roughly half of what is published here says an approach did not work, including plenty of our own. Those pages are the output, not a shortfall: knowing which direction is a dead end is what lets the next experiment go somewhere better, and most of what we now rely on came out of understanding why something else fell short. Work that only publishes what worked is not measuring anything.
- Read the Limits section. Every record ends with what it does not show. It is the most honest part of any experiment and usually the shortest.
- Pro tip: the figures near the top are designed to carry the result on their own. If you read nothing else, read the caption under each one, which says what it shows and what to take from it.
EXPLORATORY. Not a preregistered study. No training at all. It reads committed pilot output and committed pilot source. Runs in seconds on a laptop CPU, no GPU, no cost.
Program v2 Bucket Q, item Q6. Decisive computation: analysis/sharpness_audit.pyanalysis/sharpness_audit.jsonpython analysis/sharpness_audit.py.
The question
Q2 audited the fourteen implementations of when the transition happened and found them sound. It said in its Limits that it had left the other family alone. That family is how abrupt the transition was, and it is the one the programme's scaling results actually rest on: N6's exponents, N15's re-derivation, M6's bits-versus-accuracy comparison and M5's original measurement are all sharpness.
There are three implementations. The most-used one, M6's, is shared by four pilots:
`` total = max(values) - min(values) biggest = largest change across any SHARPNESS_WINDOW consecutive readings linear = SHARPNESS_WINDOW / len(values) return (biggest / total) / linear ``
It is normalised twice by the run: by the run's own range, and by the run's own number of readings. And SHARPNESS_WINDOW counts readings, not steps, so what it spans depends on the evaluation cadence a pilot happened to pick. The four pilots sharing this function share neither setting:
| Pilot | Steps | EVAL_EVERY | Readings | Window, in steps |
|---|---|---|---|---|
compression_view (M6) | 400 | 1 | 400 | 5 |
capacity_ratio (N6) | 2,500 | 5 | 500 | 25 |
width_floor (M5) | 2,500 | 5 | 500 | 25 |
algorithm_agreement | per task | per task | varies | varies |
CLAUDE.md already warns that sharpness is not comparable across run lengths. Nobody had measured how far off it goes, and nobody had looked at the second axis at all.
Kill test, fixed before execution: M6's sharpness changes by less than 10% on the same curves under either a 20% truncation or a halving of the evaluation cadence.
A prediction written down in advance, so the result is checkable rather than merely measured: truncation cannot change biggest / total when the tail is flat, and multiplies linear by 1/0.8. Sharpness should therefore fall by exactly 20% and no more. A different figure would mean the tail is not flat and the mechanism is not purely arithmetic.
What we found: the kill test does not fire
1,091 committed per-step accuracy series, 29 pilots, every definition called as the committed original.
| Definition | Answers | Truncate 20% | Halve the cadence |
|---|---|---|---|
algorithm_agreement.sharpness (M6's, 4 pilots) | 1,091 | -19.7% | -12.1% |
composed_world.sharpness (crossing width) | 1,041 | -0.5% | +0.1% |
echo_state.sharpness (crossing width) | 1,084 | 0.0% | 0.0% |
The prediction lands. Predicted -20.0% from arithmetic alone; observed -19.7%. The mechanism is the normaliser, not the data: the same curve, measured over a run a fifth longer, reports itself a fifth sharper.
The second axis is the larger one, and it had never been looked at. Sharpness responds to the evaluation cadence, which is a property of the logging code and nothing else:
| Readings kept | Change in M6's sharpness |
|---|---|
| every 2nd | -12.1% |
| every 5th | -29.8% |
| every 10th | -50.3% |
Every 5th reading is exactly the difference between M6's grid (EVAL_EVERY = 1) and N6's (EVAL_EVERY = 5). A sharpness from M6's pilot and a sharpness from N6's differ by about 30% on identical curves, before any question of what the model did. The length normaliser adds another 1.25x between the extremes of the four.
The two definitions that measure a crossing width in steps are immune, -0.5% and 0.0%. They are not normalised by the run's length at all, so there is nothing for the grid to move.
Does it damage anything published? No, and the reason is worth recording
Every sharpness comparison in the archive turns out to be within one grid:
- M6 compares the bits curve against the accuracy curve on the same runs: its
93%is a ratio inside one grid. - N6 fits twenty cells all at
2,500steps andEVAL_EVERY = 5, and its anchor to M5 is explicitly matched on "steps, rate, batch and evaluation cadence". - N15 recomputes N6 on N6's own runs.
algorithm_agreementcompares agreement sharpness against accuracy sharpness within each task, never across the400-step and1,200-step tasks.- M5's own record already says it: "comparisons to another record's sharpness are not [valid]".
The discipline held. That is the finding, and it is only visible because the hazard has now been sized: the warning in CLAUDE.md was worth 30% on the one cross-grid pair that exists in this archive, and it was obeyed.
What to take from this
- Sharpness is not a property of a curve. It is a property of a curve and the grid it was measured on. Quote the grid whenever you quote the number: run length, evaluation cadence, and the window in steps rather than readings.
- Prefer an endpoint measured in the units of the thing. The two crossing-width definitions return steps and are immune to both perturbations. M6's returns a dimensionless multiple of a straight line and is sensitive to both. The same pattern as Q2, where the one definition anchored outside the run was the one that did not drift.
- A window counted in samples is a window of unknown length.
SHARPNESS_WINDOW = 5means five training steps in one pilot and twenty-five in another. Nothing warns you. - Predict the artefact before measuring it. The
-20.0%prediction cost one line of algebra and turned a measurement into a test: had the observed figure been-35%, something other than the normaliser would have been moving, and that would have been the real result.
Limits
- The corpus is delayed-copy and dispatch-copy accuracy curves from committed pilots. A curve with a very different tail shape could respond differently to truncation, though the arithmetic bound holds regardless.
- Thinning is not the same as having logged less often. It reuses readings a real run produced, so it captures the normaliser and window effects exactly but not any interaction with when evaluation happens to fall.
- "No published comparison trips it" was verified by reading the four pilots and their records, not by a check in code. A future pilot could introduce a cross-grid comparison with nothing to catch it. The census in this audit fails if a fourth definition appears; it does not fail if a fifth pilot adopts M6's with a new grid.
- The two crossing-width definitions are immune to these perturbations. They inherit Q2's finding instead: both are anchored on the run's own floor and ceiling, so both are exposed to a still-climbing ceiling.
Terms on this page
Every piece of vocabulary this record uses, in plain language. Generated from the text above, so it cannot drift out of step with it.
- accuracy
- The fraction of answers a model gets right on questions it was not trained on.
- exponent
- The number in a power law that says how strongly one quantity responds to another. A bigger exponent means a steeper response to the same doubling.
- kill test
- A condition written down before running the experiment that says what result would make us abandon the idea. Fixing it in advance is what stops a disappointing result being reinterpreted as an encouraging one.
- sharpness
- How abrupt a model's improvement is. We measure the biggest change over any short stretch of training as a share of the run's total change, scaled so that a model improving at a perfectly steady rate would score 1. A score of 20 means the fastest stretch was twenty times steeper than a straight line.
- truncation
- Cutting a record short. Here it means discarding the last part of a finished training run and recomputing a measurement as if the run had stopped earlier, to see whether the answer depends on how long the run went on.
- width
- How many internal numbers a model uses at each layer. The usual way we vary model size in these experiments.
Get new results as we publish them
Roughly monthly, one finding per email, in plain English first. Including the approaches that turned out not to work, which are usually the useful ones. No sales email.
Double opt-in: we send a confirmation link and add nobody who does not click it. One-click unsubscribe on every email.