
The Scoring Inflated The Imbalance
Ongoing research. This is an experimental result from active work, not a settled conclusion. The numbers are what we measured and the method is described so you can judge it, but the programme is still running and later experiments may revise what it means.
A note on the language in these records. This is a working laboratory notebook for research into training AI models more cheaply and efficiently, so you will read that an approach did not work, that a result did not hold up, or that one method was worse than another. That is the research doing its job, not a verdict on the engineering we deliver to clients. Ruling an approach out is how the search narrows, and these are the pages that teach us the most: nearly every technique we now rely on came from understanding why something else fell short. Testing our own ideas at least as hard as anyone else's is the point of publishing them. More about this programme and why we run it.
Part of a bigger question: How do we know our own results are real? – Repeatedly, the control rather than the measurement decided the result -- and several striking findings dissolved when the right comparison was finally run.
In plain English
What we asked. Models here improve suddenly rather than gradually, and how sudden that is depends on two things: how big the model is, and how hard its task is. We had measured how much each one matters and found they matter unequally, which was our only result about how these effects scale. All of it was measured by counting the fraction of answers the model gets right, and counting right answers involves a cutoff: an answer is either correct or it is not, no matter how close the model was.
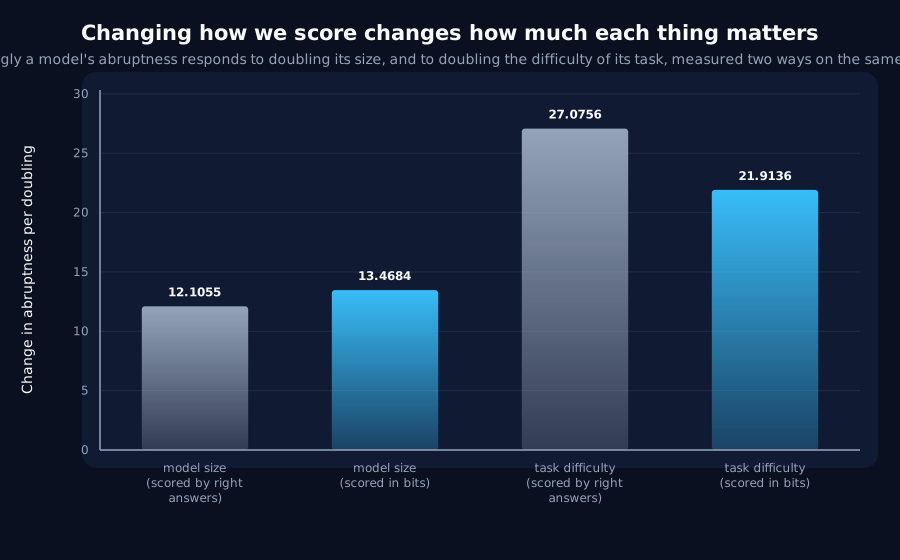
What we found. Measured without that cutoff, on the identical runs, both things still matter and still matter unequally, so the conclusion holds. But the size of the imbalance drops by about a third, and the two ingredients move in opposite directions: model size looks slightly more important without the cutoff and task difficulty looks noticeably less. Counting right answers had been overstating how much difficulty matters relative to size. Anyone quoting our old figure should quote the new one, or say which measurement they mean.
Why it matters. The thing worth copying here is that both measurements come from the same runs. We recorded the old measure and the new one side by side at every checkpoint, which means the old result acts as an exact check that nothing else changed: it reproduces our published figures to every digit. Had we simply run the experiment again with the new measure, any difference would have been impossible to separate from ordinary run-to-run variation. There is also a smaller lesson we nearly learned the hard way. Our first attempt to reproduce the old figures came out six per cent off, which is small enough to shrug at, and it turned out we had forgotten a filter the original applied that drops runs which had not finished settling. Six per cent is exactly the size of error that gets waved through and then quietly poisons whatever comes next.
The rest of this page is the technical record: the design, every number, and the limits. It is written for a reviewer, and you do not need it to have understood the result above.
New here? How to read a research record
- Start at the verdict. Every record states, before the experiment was run, what result would have made us abandon the idea. That is the "kill test". Then it says whether the test fired. Nothing gets reinterpreted after the fact.
- Numbers in square brackets are uncertainty.
23.4 [18.1, 28.7]means our best estimate is 23.4 and the true value is probably somewhere in that range. If a range includes zero, we cannot claim an effect. - Results that rule an idea out are kept. Roughly half of what is published here says an approach did not work, including plenty of our own. Those pages are the output, not a shortfall: knowing which direction is a dead end is what lets the next experiment go somewhere better, and most of what we now rely on came out of understanding why something else fell short. Work that only publishes what worked is not measuring anything.
- Read the Limits section. Every record ends with what it does not show. It is the most honest part of any experiment and usually the shortest.
- Pro tip: the figures near the top are designed to carry the result on their own. If you read nothing else, read the caption under each one, which says what it shows and what to take from it.
EXPLORATORY. Not a preregistered study. Local CPU, 100 runs at 2500 steps, no GPU, no cost.
Program v2 Bucket N, item N15. Decisive computation: analysis/capacity_ratio_bits.pyanalysis/capacity_ratio_bits.jsonpython analysis/capacity_ratio_bits.py; --reuse re-derives every endpoint without retraining.
The question
N6 is this programme's only scaling-shaped statement: sharpness moves +12.11 per doubling of width against -27.08 per doubling of task demand, a ratio of 2.24 where collapse onto a single capacity-over-demand number would need 1.00. Its conclusion is that the two axes are unequal, so abruptness does not reduce to "size over difficulty".
All of it is computed on held-out accuracy, which is an argmax. M6 found the transition survives being measured in bits, keeping 93% of its sharpness, and N11 found that on the dispatch task the scoring threshold makes an apparent staircase. Every thresholded endpoint deserves its unthresholded twin. M6 tested whether a transition exists under a change of measure, not how its magnitude scales, which is the whole of N6.
Kill test, fixed before execution: the exponent ratio computed on held-out loss differs from 2.24 by more than the seed-noise interval.
What we found
| Endpoint | Width exponent | Demand exponent | Ratio |
|---|---|---|---|
| accuracy (the anchor) | +12.11 | -27.08 | 2.24 |
| bits | +13.47 | -21.91 | 1.63 |
Leave-one-seed-out, refitting with each seed dropped in turn:
| Endpoint | Ratio across five folds |
|---|---|
| accuracy | 2.235 to 2.254 |
| bits | 1.625 to 1.651 |
They do not overlap, and are not close to overlapping. The gap of 0.61 is roughly twenty-four times the seed spread. The kill test fires.
What survives and what does not
N6's conclusion survives. Its number does not.
At 1.63 the two axes are still unequal, collapse onto a single capacity-over-demand ratio needs 1.00, and 1.63 is nowhere near it. So abruptness still does not reduce to size over difficulty, which is N6's actual claim and the one the programme has been leaning on.
But the argmax inflates the imbalance by about 37%. The two exponents move in opposite directions under the change of measure: width strengthens from +12.11 to +13.47 (+11%) while demand weakens from -27.08 to -21.91 (-19%). The threshold is doing more to the demand axis than to the width axis, which is not what one would guess and is the substantive finding here.
Anything quoting 2.24 as the size of the imbalance should quote 1.63 instead, or say which measure it means. N14's free schedule was fitted against N6's description of difficulty, and whether it inherits this is not tested here.
Design notes worth reusing
Both endpoints come from the same runs. Accuracy and bits are recorded at every evaluation of the same 100 runs, so the accuracy fit is an exact anchor rather than a cross-run comparison, it reproduces N6's +12.105, -27.076, 2.237 to every printed digit, on the same 17 of 20 cells. A separate re-run would have left the difference confounded with run-to-run variation.
The settledness gate is judged on the accuracy curve for both endpoints, so the two fits are computed over the same cells. Gating each on its own curve would let the endpoints differ because they dropped different cells rather than because they measure different things.
The gate matters more than it looks. A first refit of N6's own committed curves without it gave +11.35 against the published +12.11: a 6% gap, small enough to shrug at, and large enough to have poisoned the anchor. M5's still-climbing check exists because sharpness is a share of the run's total change, so a curve still rising at the end under-reports.
Limits
- Five seeds, so the leave-one-out spread is a coarse noise estimate. It is what five seeds allow, and the separation is 24x it.
- Held-out loss is negated so both curves rise; sharpness is range-relative, so the sign convention cannot affect the result, but it is stated rather than assumed.
- One task family (delayed-copy at five difficulties), one architecture, four widths, N6's grid unchanged, which is the point.
- This does not re-derive N14, which fitted a schedule against N6's difficulty description. Whether that inherits the inflation is untested.
- Sharpness is itself a constructed measure: largest change over a window as a share of the total, against a straight-line baseline. Both endpoints use it identically, so the comparison is fair, and a different sharpness definition could give different exponents.
Terms on this page
Every piece of vocabulary this record uses, in plain language. Generated from the text above, so it cannot drift out of step with it.
- accuracy
- The fraction of answers a model gets right on questions it was not trained on.
- architecture
- The blueprint of a model: what components it has and how they connect. Two models can be the same size and completely different architectures.
- argmax
- Short for 'the argument that maximises'. A model outputs a score for every possible next token; the argmax is simply whichever one scored highest. Accuracy is measured on the argmax, which is why accuracy is a thresholded quantity: only the winner counts, and by how much it won is discarded.
- baseline
- The thing you compare against. A result without one is not a result.
- exponent
- The number in a power law that says how strongly one quantity responds to another. A bigger exponent means a steeper response to the same doubling.
- held-out
- Data the model was never trained on, kept back specifically to test it. Scoring a model on data it has already seen measures memorisation, not learning.
- kill test
- A condition written down before running the experiment that says what result would make us abandon the idea. Fixing it in advance is what stops a disappointing result being reinterpreted as an encouraging one.
- leave-one-out
- A way of testing a rule fitted to data: leave one measurement out, fit the rule on the rest, and see how well it predicts the one you held back. It stops a rule from being graded on the data it was built from.
- seed
- The number that fixes all the randomness in a training run. Same seed, same run. Running several seeds is how you tell a real effect from a lucky one.
- sharpness
- How abrupt a model's improvement is. We measure the biggest change over any short stretch of training as a share of the run's total change, scaled so that a model improving at a perfectly steady rate would score 1. A score of 20 means the fastest stretch was twenty times steeper than a straight line.
- width
- How many internal numbers a model uses at each layer. The usual way we vary model size in these experiments.
Get new results as we publish them
Roughly monthly, one finding per email, in plain English first. Including the approaches that turned out not to work, which are usually the useful ones. No sales email.
Double opt-in: we send a confirmation link and add nobody who does not click it. One-click unsubscribe on every email.