
What Actually Decides When a Model Learns
Ongoing research. This is an experimental result from active work, not a settled conclusion. The numbers are what we measured and the method is described so you can judge it, but the programme is still running and later experiments may revise what it means.
A note on the language in these records. This is a working laboratory notebook for research into training AI models more cheaply and efficiently, so you will read that an approach did not work, that a result did not hold up, or that one method was worse than another. That is the research doing its job, not a verdict on the engineering we deliver to clients. Ruling an approach out is how the search narrows, and these are the pages that teach us the most: nearly every technique we now rely on came from understanding why something else fell short. Testing our own ideas at least as hard as anyone else's is the point of publishing them. More about this programme and why we run it.
Part of a bigger question: What decides when a model learns, and can you change it? – Settings dominate, data barely matters, and there is a brief window before the jump in which interrupting the model is unusually costly. Timing can be delayed but not brought forward.
In plain English
What we asked. Models of this kind spend a long time getting nowhere and then suddenly get the task right. We had an idea queued up that depended on particular training examples being able to trigger that moment, which would mean you could find those examples and show them first. Before building it, we asked whether the data controls the timing at all.
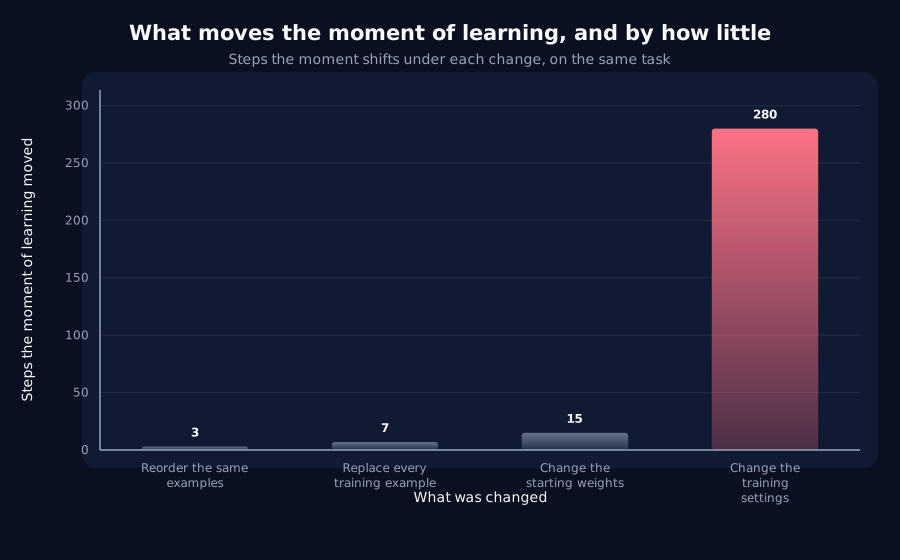
What we found. Barely. Swapping out every single training example for a completely different set moves the moment by about seven steps. Shuffling the same examples into a different order moves it by three. Changing two ordinary settings, the ones anyone tuning a model adjusts by hand, moves it by nearly three hundred. So the data is worth roughly one fortieth of what the settings are worth.
Why it matters. That does not disprove the idea, and we were careful to say so: it puts a ceiling on how much it could ever be worth. The more useful part is what nearly happened. The formal test we designed produced a number of 0.49 against a cutoff of 0.50, which would have read as a clean result killing the idea outright. Its margin of error ran from 0.22 to 1.58, meaning the effect could plausibly have gone the other way entirely. We reported that the test settled nothing, and reported the ceiling instead, which needed no such test.
The rest of this page is the technical record: the design, every number, and the limits. It is written for a reviewer, and you do not need it to have understood the result above.
New here? How to read a research record
- Start at the verdict. Every record states, before the experiment was run, what result would have made us abandon the idea. That is the "kill test". Then it says whether the test fired. Nothing gets reinterpreted after the fact.
- Numbers in square brackets are uncertainty.
23.4 [18.1, 28.7]means our best estimate is 23.4 and the true value is probably somewhere in that range. If a range includes zero, we cannot claim an effect. - Results that rule an idea out are kept. Roughly half of what is published here says an approach did not work, including plenty of our own. Those pages are the output, not a shortfall: knowing which direction is a dead end is what lets the next experiment go somewhere better, and most of what we now rely on came out of understanding why something else fell short. Work that only publishes what worked is not measuring anything.
- Read the Limits section. Every record ends with what it does not show. It is the most honest part of any experiment and usually the shortest.
- Pro tip: the figures near the top are designed to carry the result on their own. If you read nothing else, read the caption under each one, which says what it shows and what to take from it.
EXPLORATORY. Not a preregistered study. Local CPU, 34 training runs, no GPU, no cost.
Program v2 tier 4, item A10. Decisive computation: analysis/data_or_optimisation.pyanalysis/data_or_optimisation.jsonpython analysis/data_or_optimisation.py in about twenty minutes on a throttled laptop CPU. The numbers below reproduced exactly on a second execution.
The question
A8 proposes catalyst examples: that particular training examples trigger the transition, so finding them and front-loading them would make it arrive earlier. A10 is the cheap gate on that whole branch, and the backlog says to run it first for exactly that reason.
Kill test, from docs/research-program-v2.md: if reordering data at fixed initialisation moves the transition much less than seed noise does, specific examples do not control transition timing and A8 is dead before it runs.
Four arms, because "the data" means two different things
Varying the data seed on a streaming generator changes which examples the model sees. Permuting a fixed pool changes the order it sees them in while holding the content identical. A8 needs both to fail, so both are measured.
A determinism check runs first, the same configuration twice gave the same transition (step 160.0 both times), without which none of the spreads below would mean anything.
| Arm | What varies | Mean transition | Spread | Std dev | Spread as % of mean |
|---|---|---|---|---|---|
| content | different examples, init fixed | 158.8 | 7 | 2.4 | 4.4% |
| order | same examples reshuffled, init fixed | 156.4 | 3 | 0.9 | 1.9% |
| initialisation | init varies, data fixed | 157.8 | 15 | 4.8 | 9.5% |
| both | ordinary seed noise | 156.1 | 20 | 5.7 | 12.8% |
A free consistency check comes out right: if initialisation and data perturb timing roughly independently, the both-vary arm's variance should be about the sum of the other two. It is 32.1 against 29.0, a ratio of 1.11.
The ratio test cannot settle it, and nearly said it could
The kill test is phrased as a comparison, data spread against seed noise, so the natural endpoint is the ratio of standard deviations. Those ratios are:
| Comparison | Point | Bootstrap 95% interval |
|---|---|---|
| content vs initialisation | 0.49x | [0.22, 1.58] |
| order vs initialisation | 0.19x | [0.08, 0.66] |
Read "much less" as under half, and the point estimates both clear it, content by one hundredth. A criterion on point estimates would have declared the kill test fired and A8 dead, on a number that landed at 0.49 against a threshold of 0.50.
Both intervals cross 0.5. The content interval reaches 1.58, which is to say the data arm's spread could plausibly be larger than the initialisation arm's. Nothing is established.
This is a ratio of two standard deviations estimated from eight runs each, and it is far noisier than it looks. The smoke test made that concrete before the full run: at three replicas the same comparison produced 3.12x, from standard deviations of 3.6 against 1.2. The kill test as literally specified cannot be evaluated at this replica count, and tightening the ratio enough would take many times the runs.
What is established: the bound
The ratio is underpowered. The absolute movement is not, and it answers what A8 actually needs to know without any ratio at all.
A catalyst-example effect, whatever it might be, has to fit inside the movement produced by replacing every training example. That is measured here directly:
| Manipulation | Moves the transition by |
|---|---|
| Reordering the same examples | 3 steps (1.9%) |
| Replacing every training example | 7 steps (4.4%) |
| Changing the initialisation | 15 steps (9.5%) |
| Changing learning rate and batch size (F1) | 280 steps |
Data is worth about 2.5% of what the settings are worth. Swap out the entire training stream for a different one and the transition moves by seven steps; change the learning rate and it moves by hundreds.
Verdict
- The kill test is not evaluable at this replica count. A8 is not formally killed, and the record says so rather than reporting the point estimate that would have killed it.
- A8's ceiling is now known and it is low. Any catalyst effect must fit inside seven steps, or 2.5% of what an ordinary hyperparameter change achieves. A branch whose best case is a 4% movement is not a branch worth opening while cheaper axes move the same quantity by 180%.
- Timing is set by the settings, not by the data and not much by the initialisation. This agrees with F1's phase diagram from the opposite direction: F1 showed timing moves smoothly and predictably with hyperparameters, and A10 shows the things F1 held fixed barely matter.
The honest summary is that A10 answers a different question from the one it was written to ask, and the substitute is more useful: not "is data or optimisation responsible" but "how much could data possibly be worth", which is bounded and small.
Limits
- Eight replicas per arm is too few for the ratio and enough for the bound. The bound is a direct measurement of spread; the ratio is a quotient of two noisy estimates. Only the second needed more data.
- The order arm uses a fixed 4,096-example pool and therefore a multi-epoch regime, while the other three stream fresh examples. That difference is unavoidable, holding content constant requires a finite pool, but it means the order arm is not a like-for-like comparison with the rest, and its unusually small spread (
0.9) may partly reflect the regime rather than the manipulation. - One architecture, one task, one width, one learning rate, one batch size.
- The bound applies to timing. Nothing here says specific examples do not matter for what the model learns, only that they barely move when it learns.
Terms on this page
Every piece of vocabulary this record uses, in plain language. Generated from the text above, so it cannot drift out of step with it.
- architecture
- The blueprint of a model: what components it has and how they connect. Two models can be the same size and completely different architectures.
- batch size
- How many examples the model looks at before updating itself once. Bigger batches give a steadier but more expensive update.
- bootstrap
- A way of estimating how uncertain a number is by repeatedly resampling the data you already have. Useful when the usual formulas do not apply.
- epoch
- One full pass through the training data.
- kill test
- A condition written down before running the experiment that says what result would make us abandon the idea. Fixing it in advance is what stops a disappointing result being reinterpreted as an encouraging one.
- learning rate
- How big a step training takes each time it updates the model. Too small and nothing happens; too big and it never settles.
- phase diagram
- A map showing what a system does across combinations of settings, so you can see where behaviour changes rather than testing one point at a time.
- seed
- The number that fixes all the randomness in a training run. Same seed, same run. Running several seeds is how you tell a real effect from a lucky one.
- variance
- How spread out a set of numbers is. Rising variance in a signal means it is becoming more erratic.
- width
- How many internal numbers a model uses at each layer. The usual way we vary model size in these experiments.
Get new results as we publish them
Roughly monthly, one finding per email, in plain English first. Including the approaches that turned out not to work, which are usually the useful ones. No sales email.
Double opt-in: we send a confirmation link and add nobody who does not click it. One-click unsubscribe on every email.