
A Dial, Not a Switch
Ongoing research. This is an experimental result from active work, not a settled conclusion. The numbers are what we measured and the method is described so you can judge it, but the programme is still running and later experiments may revise what it means.
A note on the language in these records. This is a working laboratory notebook for research into training AI models more cheaply and efficiently, so you will read that an approach did not work, that a result did not hold up, or that one method was worse than another. That is the research doing its job, not a verdict on the engineering we deliver to clients. Ruling an approach out is how the search narrows, and these are the pages that teach us the most: nearly every technique we now rely on came from understanding why something else fell short. Testing our own ideas at least as hard as anyone else's is the point of publishing them. More about this programme and why we run it.
Part of a bigger question: What actually happens at the moment a model learns? – It builds machinery rather than selecting it, working through the task in a reproducible order and trying a simpler wrong rule on the way. The visible training curve cannot tell you which is happening.
In plain English
What we asked. An earlier experiment of ours showed that a particular internal change only happens when a model is genuinely learning: give it completely scrambled answers to train on and the change does not appear. That was a yes-or-no test, and yes-or-no tests leave the more interesting question open. Is this an all-or-nothing thing that switches on when a model starts learning, or does it have a size that depends on how much there is to learn?
What we found. It has a size. We scrambled a quarter of the training answers, then half, then three quarters, then all of them, and measured at each step. The change gets steadily smaller every time, with no sudden drop anywhere, and both of our ways of measuring agree. Across all forty runs it tracks how much of the real task each model actually managed to learn almost exactly. So we can now say how much of this internal change there should be, rather than only that there is some, which is a claim that is easier for us or anyone else to prove wrong.
Why it matters. Most of the work was in the measurement, and we got it wrong twice before getting it right. Scrambling the answers changes not just how much a model learns but when it starts, and our first two ways of measuring both assumed we knew when to look. The first produced a curve that went up and then down, which nothing predicted and which turned out to be our measuring window sitting in a different place relative to each model's learning moment. The second failed a check we now run as standard: on the clean task, where we are most confident the effect is real, it could not tell the effect apart from measuring at a random moment. We had actually written down why that happens in an earlier write-up and did not reread our own note. The method that works is the one that does not need to know when to look.
The rest of this page is the technical record: the design, every number, and the limits. It is written for a reviewer, and you do not need it to have understood the result above.
New here? How to read a research record
- Start at the verdict. Every record states, before the experiment was run, what result would have made us abandon the idea. That is the "kill test". Then it says whether the test fired. Nothing gets reinterpreted after the fact.
- Numbers in square brackets are uncertainty.
23.4 [18.1, 28.7]means our best estimate is 23.4 and the true value is probably somewhere in that range. If a range includes zero, we cannot claim an effect. - Results that rule an idea out are kept. Roughly half of what is published here says an approach did not work, including plenty of our own. Those pages are the output, not a shortfall: knowing which direction is a dead end is what lets the next experiment go somewhere better, and most of what we now rely on came out of understanding why something else fell short. Work that only publishes what worked is not measuring anything.
- Read the Limits section. Every record ends with what it does not show. It is the most honest part of any experiment and usually the shortest.
- Pro tip: the figures near the top are designed to carry the result on their own. If you read nothing else, read the caption under each one, which says what it shows and what to take from it.
EXPLORATORY. Not a preregistered study. Local CPU, 40 training runs, no GPU, no cost.
Program v2 Bucket J, item J4. Decisive computation: analysis/corruption_dose.pyanalysis/corruption_dose.jsonpython analysis/corruption_dose.py in about an hour, or re-decide the endpoint from the saved series with --reuse.
The question
I6 supplied the negative control this programme had never had: a model trained on the same inputs with the targets replaced by noise shows no expansion, 25x below one that learns. But that control is binary, and its own Limits name the follow-up. A binary control tells you the effect needs learning. A dose-response curve tells you what kind of thing it is.
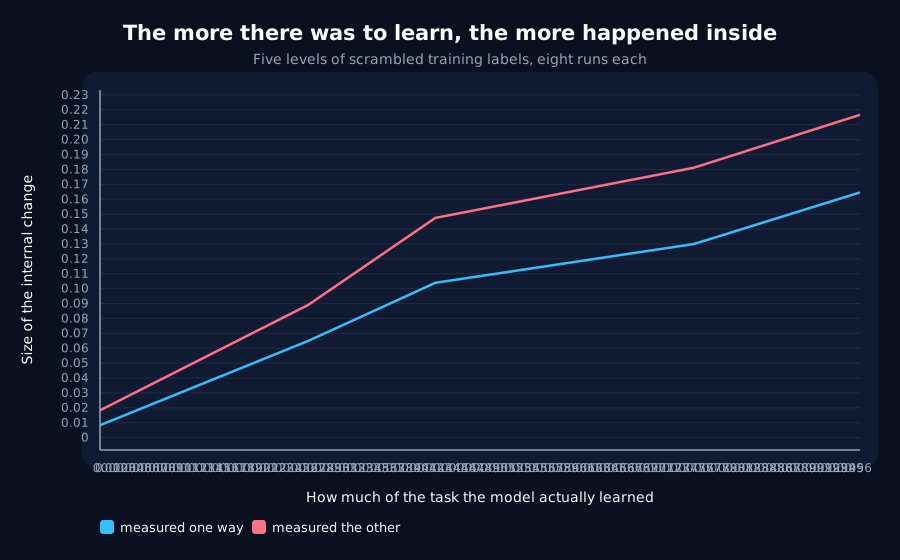
Corrupt the training labels at 0%, 25%, 50%, 75% and 100% and measure the same endpoint at each. Three shapes were possible and they mean different things: graded (a quantity), flat then cliff (a threshold), or flat throughout (which would contradict I6).
Kill test: the expansion is flat in corruption level, or steps from full to zero with nothing in between.
One design improvement over I6: accuracy is scored against the TRUE targets at every level, including the fully corrupted one. I6 randomised its held-out targets too, so its unlearnable arm sat at chance by construction; here the same axis measures how much of the real task was actually learned, which is the quantity the expansion is supposed to scale with.
Result: graded, and it tracks what was learned almost exactly
| Corruption | Final accuracy | Learned above chance | Expansion, moving frame | Expansion, frozen frame |
|---|---|---|---|---|
| 0% | 0.9940 | 0.9628 | +0.1646 [+0.1595, +0.1698] | +0.2167 [+0.2094, +0.2239] |
| 25% | 0.7840 | 0.7528 | +0.1300 [+0.1214, +0.1385] | +0.1811 [+0.1702, +0.1921] |
| 50% | 0.4572 | 0.4259 | +0.1039 [+0.0950, +0.1128] | +0.1474 [+0.1379, +0.1569] |
| 75% | 0.2967 | 0.2655 | +0.0650 [+0.0596, +0.0704] | +0.0891 [+0.0849, +0.0934] |
| 100% | 0.0310 | 0.0020 | +0.0084 [+0.0070, +0.0098] | +0.0184 [+0.0150, +0.0217] |
Monotonic at every step, in both frames, with non-overlapping intervals throughout.
The change between consecutive levels is +0.0346, +0.0261, +0.0389, +0.0566. The largest single fall is 36% of the total change: a clean threshold would put nearly 100% in one step and a perfectly straight line would put 25% in each. This is a graded decline with a mild acceleration at the unlearnable end.
Across all 40 runs individually, the expansion correlates with how much was actually learned at r = +0.971. That uses the within-level variation as well as the between-level trend.
Verdict
- The kill test fires on its letter, and the answer is the informative one. The expansion is neither flat nor a cliff. It is a quantity that tracks how much there is to learn.
- "Accompanies acquisition" can now be stated as a proportion rather than a yes. That is a stronger and more falsifiable claim than I6's binary result, and it upgrades I6 rather than replacing it: I6's two arms are this curve's two endpoints.
- It is not a threshold phenomenon, so nothing here supports treating the transition as a switch that either fires or does not.
The endpoint had to be chosen carefully, and the first two choices were wrong
This is most of the work, and it is worth reading before trusting the table above.
Corruption moves the transition. Events land at ~137, ~170, ~94 and ~110 steps at 0%, 25%, 50% and 75%. That single fact broke two endpoints in turn:
First attempt: a window fixed in absolute time, with the reference frame frozen at step 100. The 50% arm transitions at step 94, before its own frame was frozen, and the 0% arm's rise sat inside the "before" half of its own window. The measured curve was an inverted U peaking at 50% corruption, entirely an artifact of where each level's event fell relative to a window that could not follow it. Two secondary bugs surfaced with it: the verdict logic compared only the first and last levels and called a non-monotonic curve "flat", and divided by a sum of signed steps near zero, printing "largest single drop is 1489% of the total".
Second attempt: a window centred on each run's own event. Correct in principle, and still wrong, because of something I6's own record had already documented: a symmetric window centred on a peak cancels the rise against the fall. The check that caught it is the one that matters:
| Clean task (0% corruption), moving frame | |
|---|---|
| window at the event | +0.0140 |
| window at a random time | +0.0170 |
| difference | -0.0030 |
On the clean task, where this effect is best established in the whole programme, the event-aligned endpoint does not beat random placement. An endpoint that cannot see the effect where the effect certainly is cannot be trusted to measure how the effect changes. Using it as the primary here was I6's own warning going unread.
What works: the best window anywhere in the trajectory, I6's endpoint, applied identically at every level. It is the only endpoint here that does not require knowing when the event is, which is exactly the thing corruption changes. It is a maximum over placements and therefore biased upward, but that bias applies equally at every level, so it cannot manufacture a trend, and a trend is what this pilot measures.
Limits
- The upward bias is real, so no single number in the table should be read as an effect size. Only the shape of the column is claimed. I6's absolute values are the ones to quote.
- 8 seeds per level, one width, one task, one architecture, one learning rate, five dose levels.
- Corruption is uniform random relabelling at the scored positions, applied per position rather than per batch. Structured corruption (a systematically wrong label, or a shifted lag) is a different manipulation and might not behave the same way.
- Corruption changes two things at once: how much is learnable, and how noisy the gradient is. A design that held gradient noise fixed while varying learnability would separate them, and this one does not.
- The
100%arm has no event, so its value comes from the best-window fallback alone. That is the same endpoint as the others, which is why the fallback was chosen, but it is worth naming.
Terms on this page
Every piece of vocabulary this record uses, in plain language. Generated from the text above, so it cannot drift out of step with it.
- accuracy
- The fraction of answers a model gets right on questions it was not trained on.
- architecture
- The blueprint of a model: what components it has and how they connect. Two models can be the same size and completely different architectures.
- gradient
- The direction and amount by which each of a model's internal numbers should change to do slightly better. Training is repeatedly following it.
- held-out
- Data the model was never trained on, kept back specifically to test it. Scoring a model on data it has already seen measures memorisation, not learning.
- kill test
- A condition written down before running the experiment that says what result would make us abandon the idea. Fixing it in advance is what stops a disappointing result being reinterpreted as an encouraging one.
- learning rate
- How big a step training takes each time it updates the model. Too small and nothing happens; too big and it never settles.
- seed
- The number that fixes all the randomness in a training run. Same seed, same run. Running several seeds is how you tell a real effect from a lucky one.
- width
- How many internal numbers a model uses at each layer. The usual way we vary model size in these experiments.
Get new results as we publish them
Roughly monthly, one finding per email, in plain English first. Including the approaches that turned out not to work, which are usually the useful ones. No sales email.
Double opt-in: we send a confirmation link and add nobody who does not click it. One-click unsubscribe on every email.