
The One That Was Not A Ruler
Ongoing research. This is an experimental result from active work, not a settled conclusion. The numbers are what we measured and the method is described so you can judge it, but the programme is still running and later experiments may revise what it means.
A note on the language in these records. This is a working laboratory notebook for research into training AI models more cheaply and efficiently, so you will read that an approach did not work, that a result did not hold up, or that one method was worse than another. That is the research doing its job, not a verdict on the engineering we deliver to clients. Ruling an approach out is how the search narrows, and these are the pages that teach us the most: nearly every technique we now rely on came from understanding why something else fell short. Testing our own ideas at least as hard as anyone else's is the point of publishing them. More about this programme and why we run it.
Part of a bigger question: How do we know our own results are real? – Repeatedly, the control rather than the measurement decided the result -- and several striking findings dissolved when the right comparison was finally run.
In plain English
What we asked. A model's internal state can be spread thinly across many directions or packed into a few, and how that changes during training is something a lot of recent research pays attention to. We have been cautious about it, because one of our own earlier results showed a striking rise-and-fall in exactly that kind of quantity turned out to be an artifact: we were re-deciding which directions counted as important at every step, so the thing that was moving was our ruler rather than the model.
What we found. Two papers published this year report changes in two related measures at the moment a model starts generalising. The useful thing about those two measures is that they cannot have our problem. They depend only on how spread out the state is, not on which particular directions you single out, so rotating your point of view cannot change them. We checked that numerically rather than taking it on trust, and it holds to the limit of the arithmetic.
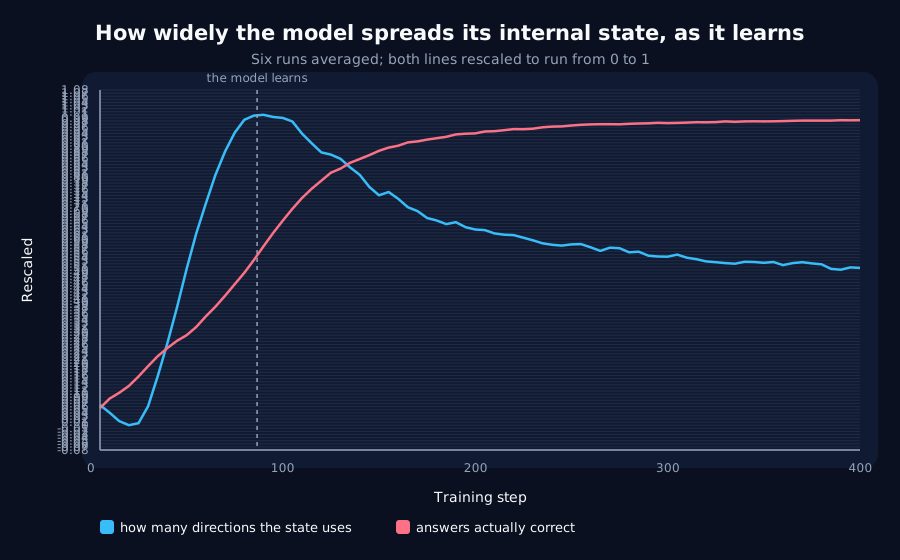
Why it matters. Measured on our own models, the spread rises steadily, peaks at the moment the model starts getting answers right, and then falls back by almost a quarter. Because this measure cannot be a ruler effect, that rise and fall is a real thing the model does. Two cautions we want to state plainly. It happens at the same time as the improvement, not before it, so it is not an early warning and cannot be used to predict anything. And one of the two published signatures moves in the opposite direction here to what was reported -- their models and ours may simply be doing different things, and a mismatch says the finding does not carry over rather than that it was wrong where it was found.
The rest of this page is the technical record: the design, every number, and the limits. It is written for a reviewer, and you do not need it to have understood the result above.
New here? How to read a research record
- Start at the verdict. Every record states, before the experiment was run, what result would have made us abandon the idea. That is the "kill test". Then it says whether the test fired. Nothing gets reinterpreted after the fact.
- Numbers in square brackets are uncertainty.
23.4 [18.1, 28.7]means our best estimate is 23.4 and the true value is probably somewhere in that range. If a range includes zero, we cannot claim an effect. - Results that rule an idea out are kept. Roughly half of what is published here says an approach did not work, including plenty of our own. Those pages are the output, not a shortfall: knowing which direction is a dead end is what lets the next experiment go somewhere better, and most of what we now rely on came out of understanding why something else fell short. Work that only publishes what worked is not measuring anything.
- Read the Limits section. Every record ends with what it does not show. It is the most honest part of any experiment and usually the shortest.
- Pro tip: the figures near the top are designed to carry the result on their own. If you read nothing else, read the caption under each one, which says what it shows and what to take from it.
EXPLORATORY. Not a preregistered study. Local CPU, 6 training runs, no GPU, no cost.
Program v2 Bucket N, item N9. Decisive computation: analysis/dimensional_signatures.pyanalysis/dimensional_signatures.jsonpython analysis/dimensional_signatures.py, or re-derive every endpoint with --reuse.
The question, and how the premise check changed it
Two 2026 preprints report geometric signatures at generalisation onset. Grokking as Dimensional Phase Transition (arXiv 2604.04655) reports effective dimensionality crossing; Spectral Entropy Collapse as a Phase Transition in Delayed Generalisation (arXiv 2604.13123) reports a collapse in spectral entropy of the penultimate representation's covariance.
D6 showed this programme's own geometric signature, the post-peak fall in residual energy, is a measurement-frame effect. The backlog asked whether the imported signatures survive the same check.
They cannot fail it, and that is the first result. Effective dimensionality (a participation ratio of the covariance spectrum) and spectral entropy (the Shannon entropy of the normalised spectrum) are both functions of eigenvalues alone, and eigenvalues are invariant under rotation. A frozen orthonormal frame is a rotation. Verified numerically rather than asserted: the largest relative gap between the moving and frozen frames across every reading of every run is 9.6e-07, which is float32 noise.
Why D6's critique reaches residual energy and not these: residual energy is defined against "the top k directions", which are re-fitted at every step. Re-fitting is not a rotation. The frame question arises for quantities measured against a re-fitted basis, and does not arise for spectral invariants. That distinction is the useful output of the premise check, and it narrows what D6 rules out.
Kill test, restated and fixed before execution: neither quantity changes materially across this programme's transition. Materiality is J4's FLOOR = 0.05, applied to each quantity as a fraction of its own value at the frame step.
Result: both move, and the kill test does not fire
Six seeds, 400 steps: M3's run length, since a floor-to-ceiling midpoint is not comparable across run lengths (N5). The anchor reproduced: accuracy midpoint 86.7 [82.4, 91.0] against M3's [82.4, 91.0].
| quantity | at the frame step | final | fractional change | largest swing |
|---|---|---|---|---|
| effective dimension | 15.35 [14.42, 16.27] | 21.09 [20.29, 21.89] | +37.8% [+27.2, +48.5] | +82.8% |
| spectral entropy | 4.381 [4.325, 4.436] | 4.829 [4.803, 4.855] | +10.3% [+8.5, +12.0] | +15.7% |
The entropy moves the wrong way
The imported claim is a collapse. Here spectral entropy rises, by +10.3% [+8.5, +12.0], with the interval well clear of zero.
That is a directional mismatch, and this programme has a standing rule about exactly this: an effect can satisfy a kill test while meaning the opposite of what the test was after. The kill test asked whether the quantity moves; it does, materially, in the direction opposite to the signature being imported.
The unplanned finding: effective dimension peaks on the event
| value | |
|---|---|
| peak effective dimension | 27.37 [26.87, 27.88] |
| peak step minus accuracy midpoint | +5.0 [−3.1, +13.1] |
| fall from peak to final | 22.9% [19.2, 26.7] |
The peak sits on the transition: the interval spans zero, so peak and midpoint are not distinguishable in time, and the quantity then falls back by nearly a quarter. Per seed the peaks land at steps 90, 90, 100, 105, 85, 80 against transitions of 90, 90, 85, 90, 85, 80.
This is the expansion-then-consolidation shape D6 examined, in a quantity D6's critique cannot touch. D6 found that our residual-energy consolidation was the retained subspace rotating rather than the expansion unwinding. Effective dimensionality is rotation-invariant, so its rise and partial fall are not a change of ruler: the representation genuinely spreads across more directions up to the transition and then genuinely re-concentrates.
Spectral entropy shows the same shape more weakly, peak +15.0 steps [+7.6, +22.4] after the midpoint, falling 4.2% [3.4, 4.9], which is consistent, entropy being the less sensitive of the two to a few dominant directions.
This does not revive program v1. Program v1 closed because reshaping activation coordinates is free, not because nothing happens to them. A real, frame-independent expansion coincident with the transition is a description of the event, and D4's rule still applies: coincident is not leading, and nothing here shows the geometry is load-bearing.
Verdict
- The frame check cannot be failed by these quantities, verified at relative
9.6e-07. D6's critique reaches re-fitted bases, not spectral invariants. - The kill test does not fire: both quantities change materially,
+37.8%and+10.3%. - Spectral entropy rises where the imported claim reports collapse.
- Effective dimensionality peaks on the transition (
+5.0steps[−3.1, +13.1]) and falls back22.9%, in a rotation-invariant quantity, so this shape is not a measurement-frame effect. - The anchor reproduced.
Limits
- Six seeds, one task, one width, one learning rate, one layer (
final_norm). - The imported papers study grokking on modular arithmetic in transformers, with a train/test gap this setting does not have. A directional mismatch says the signature does not transfer to this phenomenon, not that it is wrong in theirs. The two events may simply not be the same event.
- "Effective dimensionality" is a participation ratio here. The dimensional-transition paper's quantity is defined on the dynamics (a diffusive exponent), not on the representation covariance, so this is an analogue rather than the same measurement. The entropy comparison is closer to like-for-like.
- Peak timing is measured at 5-step resolution, and the interval on peak-minus-midpoint spans
16steps, so "peaks on the event" means "not distinguishable from it", not "exactly at it". - Nothing here is a leading indicator. The peak is coincident, which is what the constraints table already records for every geometric quantity in this programme.
- A patch to this pilot failed silently once, a scripted edit asserted its way out before writing, and the run that followed used the pre-patch units. Caught by reading the output rather than trusting the script. The numbers were unaffected; the reported gap was in the wrong units.
Terms on this page
Every piece of vocabulary this record uses, in plain language. Generated from the text above, so it cannot drift out of step with it.
- accuracy
- The fraction of answers a model gets right on questions it was not trained on.
- effective dimension
- Roughly, how many independent directions a model's internal state actually uses. High means spread out; low means squeezed onto a few.
- exponent
- The number in a power law that says how strongly one quantity responds to another. A bigger exponent means a steeper response to the same doubling.
- grokking
- When a network that has memorised its training examples suddenly, much later, learns the general rule and starts getting new examples right.
- kill test
- A condition written down before running the experiment that says what result would make us abandon the idea. Fixing it in advance is what stops a disappointing result being reinterpreted as an encouraging one.
- learning rate
- How big a step training takes each time it updates the model. Too small and nothing happens; too big and it never settles.
- phase transition
- A point in training where a model's performance jumps abruptly from bad to good, rather than improving gradually. Most of this programme is about what happens at that moment.
- residual
- How far the data sits from a proposed description of it, after the description has been fitted as well as it can be. A small residual means the description accounts for what was measured; a large one means something is missing.
- residual energy
- Our measure of how much of a model's internal activity is left over after accounting for its few strongest directions. High means the activity is spread out; low means it is concentrated.
- seed
- The number that fixes all the randomness in a training run. Same seed, same run. Running several seeds is how you tell a real effect from a lucky one.
- subspace
- A slice of a model's internal space: some directions kept, the rest ignored.
- transformer
- The architecture behind most modern large language models. It uses attention to look at every part of the input at once, rather than reading in order.
- width
- How many internal numbers a model uses at each layer. The usual way we vary model size in these experiments.
Get new results as we publish them
Roughly monthly, one finding per email, in plain English first. Including the approaches that turned out not to work, which are usually the useful ones. No sales email.
Double opt-in: we send a confirmation link and add nobody who does not click it. One-click unsubscribe on every email.