
The Spectral Peak That Was Not a Signal
Ongoing research. This is an experimental result from active work, not a settled conclusion. The numbers are what we measured and the method is described so you can judge it, but the programme is still running and later experiments may revise what it means.
A note on the language in these records. This is a working laboratory notebook for research into training AI models more cheaply and efficiently, so you will read that an approach did not work, that a result did not hold up, or that one method was worse than another. That is the research doing its job, not a verdict on the engineering we deliver to clients. Ruling an approach out is how the search narrows, and these are the pages that teach us the most: nearly every technique we now rely on came from understanding why something else fell short. Testing our own ideas at least as hard as anyone else's is the point of publishing them. More about this programme and why we run it.
Part of a bigger question: Can you tell in advance that a model is about to improve? – Yes, repeatedly and by several independent routes -- a probe on the hidden state, gradient statistics, held-out loss, and which earlier word the prediction leans on. The warnings are real; how far ahead they fire varies a great deal.
In plain English
What we asked. We went looking for an early warning of learning that would be cheap to compute, needing no test data and no extra machinery. The model's own weights seemed like the place.
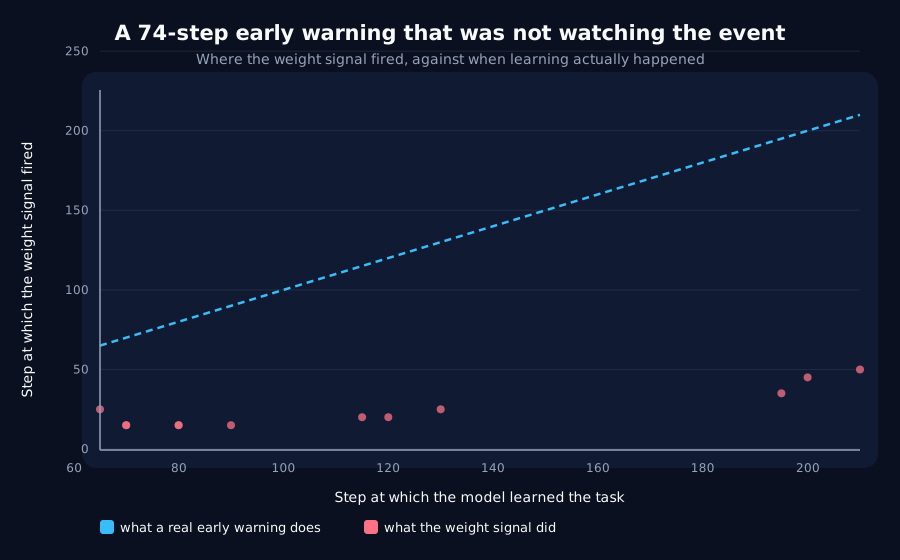
What we found. We found an enormous one, and then killed it. Eleven of twelve measurements appeared to fire about 74 steps before learning, in every single run. But when we moved the moment of learning by 145 steps, the supposed warning barely moved. It sits at a fixed early point in training and has almost nothing to do with the event it seemed to predict.
Why it matters. A signal that consistently precedes an event is not an early warning unless it follows the event when the event moves. This one did not, and the test that caught it took one afternoon. It is the cheapest useful control we know of and we would have published a wrong result without it.
The rest of this page is the technical record: the design, every number, and the limits. It is written for a reviewer, and you do not need it to have understood the result above.
New here? How to read a research record
- Start at the verdict. Every record states, before the experiment was run, what result would have made us abandon the idea. That is the "kill test". Then it says whether the test fired. Nothing gets reinterpreted after the fact.
- Numbers in square brackets are uncertainty.
23.4 [18.1, 28.7]means our best estimate is 23.4 and the true value is probably somewhere in that range. If a range includes zero, we cannot claim an effect. - Results that rule an idea out are kept. Roughly half of what is published here says an approach did not work, including plenty of our own. Those pages are the output, not a shortfall: knowing which direction is a dead end is what lets the next experiment go somewhere better, and most of what we now rely on came out of understanding why something else fell short. Work that only publishes what worked is not measuring anything.
- Read the Limits section. Every record ends with what it does not show. It is the most honest part of any experiment and usually the shortest.
- Pro tip: the figures near the top are designed to carry the result on their own. If you read nothing else, read the caption under each one, which says what it shows and what to take from it.
EXPLORATORY. Not a preregistered study. Local CPU, 22 training runs, no GPU, no cost.
Program v2 tier 3, item D4. Decisive computation: analysis/weight_spectrum.pyanalysis/weight_spectrum.jsonpython analysis/weight_spectrum.py in about twenty-five minutes on a throttled laptop CPU.
The question
The representation signal is coincident with the transition, and under SGD it lags by hundreds of steps (D8). Weights, though, have to move before behaviour can change: the accuracy jump is downstream of a parameter change, so the parameters are the natural place a leading signal would hide.
F2 already found one, worth +23.5 steps, but it needs held-out labels and a probe fitted at every check. A weight spectrum needs neither, so a weight-side signal would be usable where F2's is not.
D1 says where to look: a GRU stacks three gates per recurrent matrix, and D1 found they behave differently, so both matrices are tracked per gate rather than whole. Two quantities each: the top singular value (how far the strongest direction has grown) and the stable rank (how concentrated the matrix is, independent of scale).
Part A: an enormous apparent lead
Ten seeds. Each spectral series is timed by its peak rate of change on a smoothed derivative, because a spectrum is not monotone and a midpoint crossing would be the wrong instrument.
| Quantity | Lead over the accuracy midpoint | Runs leading |
|---|---|---|
hidden:candidate:stable_rank | +74.5 [+69.6, +79.4] | 10 / 10 |
hidden:update:stable_rank | +71.5 [+67.0, +76.0] | 10 / 10 |
hidden:reset:stable_rank | +71.0 [+66.0, +76.0] | 10 / 10 |
hidden:candidate:top | +69.5 [+64.6, +74.4] | 10 / 10 |
in:reset:stable_rank | +69.0 [+64.0, +74.0] | 10 / 10 |
… six more between +29.0 and +63.5 |
Eleven of twelve quantities lead, the longest by +74.5 steps against a transition landing at step 90: more than three times F2's lead, from a measurement needing no labels at all.
That is where this record would have stopped, and it would have been wrong.
Part B: the control, and the reason for it
A transition at step 90 with a 74-step lead puts the "signal" near step 15. That is also when weights move most for a reason having nothing to do with the transition: an untrained model fitting the marginal distribution produces the largest updates it will ever make. A peak that always sits at step 15 would produce a large, consistent, and entirely meaningless lead.
So the transition was moved. A learning-rate sweep shifts it across 145 steps:
| Learning rate | Transition |
|---|---|
| 0.0015 | 202 |
| 0.0030 | 122 |
| 0.0060 | 83 |
| 0.0120 | 68 |
If the peak is a property of the transition it should follow: slope near 1. If it sits at a fixed early step, slope near 0.
| Quantity | Slope | Correlation | Peak moved over | Tracks |
|---|---|---|---|---|
in:candidate:top | 0.96 | +0.67 | 275 | no |
in:update:top | 0.42 | +0.98 | 65 | no |
hidden:reset:top | 0.42 | +0.99 | 60 | no |
in:update:stable_rank | 0.41 | +0.98 | 60 | no |
| … | ||||
hidden:candidate:stable_rank | 0.21 | +0.91 | 35 | no |
Zero of eleven track. The transition moves 145 steps; the spectral peaks move 30 to 65.
The slopes are precisely measured, not noisy: correlations run +0.91 to +0.99. The peak does drift later when the transition does, by about a quarter to two fifths as much. That is the signature of a quantity anchored to the start of training with a weak coupling to the transition, not of a quantity announcing it.
The lead is therefore not a horizon. With slope b, lead = (1 - b) x transition - a, so at b ≈ 0.3 the lead is roughly 70% of the transition time. To use it as a warning you would already need to know when the transition was going to happen.
The one that looked like it tracked
in:candidate:top has a slope of 0.96, which is exactly what a real indicator would show. It is also the noisiest quantity in the experiment: correlation +0.67 against +0.9 or better for every other quantity, a peak wandering over 275 steps, and in Part A it led in only 7 of 10 runs with an interval of [+7.4, +52.6].
A slope is a ratio, and a ratio measured on a wandering quantity can land anywhere. A criterion on slope alone would have promoted this single quantity to the headline, so tracking requires a correlation above 0.8 as well. Under that rule nothing tracks.
Verdict: the kill test fires
CORRECTION, 2026-08-23. This record's closing claim that F2's decode probe is the program's only leading indicator was true when written and is now superseded. F1 found a second one: gradient-norm variance, leading by+25.5steps[21.5, 29.5]in 49 of 49 runs, with slope0.89atr +0.98against the very control this record was written about. It needs no labels and no probe fit, so it is also the cheap version this record says does not exist yet. The conclusion about weight spectra is unchanged : they still do not track, and the search did narrow to gradients exactly as predicted here.
Weight spectra are not a leading indicator. This is the second non-leading indicator recorded, and the search for a cheap leading signal narrows to gradients (A11), exactly as the kill test anticipated.
F2's decode probe remains the program's only leading indicator, and it keeps its costs: it needs labels and a probe fit. The cheap version does not exist yet.
The pattern, now four times over
This is the fourth time in program v2 that the measurement, not the model, produced the headline:
- A9 was unanswerable because transition times were quantised to 10 steps.
- F2 flipped verdict entirely on probe strength.
- D3 needed single-step resolution to separate a magnitude-independent response from a coarse grid.
- D4 would have reported a 74-step leading indicator that is the initial training burst.
Each was caught by asking what the instrument could do rather than by re-examining the data. The rule is cheap and it keeps paying: before believing a signal, move the thing it claims to predict and check that the signal moves with it.
Limits
- One architecture, one task, one width, one optimizer, and the sweep uses three seeds per rate against ten in Part A.
- The peak-rate-of-change timing is one choice among several. A different definition, such as the first crossing of a threshold rate, might time a different feature of the same curve; the control in Part B would apply unchanged to any of them, and is the part worth reusing.
- The learning-rate sweep moves the transition by changing the optimiser's step size, which also changes how fast the weights move at every point. A width sweep would move the transition without that coupling and is the better follow-up if this line is revisited.
Terms on this page
Every piece of vocabulary this record uses, in plain language. Generated from the text above, so it cannot drift out of step with it.
- accuracy
- The fraction of answers a model gets right on questions it was not trained on.
- architecture
- The blueprint of a model: what components it has and how they connect. Two models can be the same size and completely different architectures.
- gradient
- The direction and amount by which each of a model's internal numbers should change to do slightly better. Training is repeatedly following it.
- GRU
- Gated Recurrent Unit. A compact design for processing sequences one item at a time, with internal switches controlling what it keeps in memory.
- held-out
- Data the model was never trained on, kept back specifically to test it. Scoring a model on data it has already seen measures memorisation, not learning.
- kill test
- A condition written down before running the experiment that says what result would make us abandon the idea. Fixing it in advance is what stops a disappointing result being reinterpreted as an encouraging one.
- learning rate
- How big a step training takes each time it updates the model. Too small and nothing happens; too big and it never settles.
- optimizer
- The algorithm that decides how to change the model given the gradient. AdamW and SGD are two common choices and they behave differently.
- parameters
- The adjustable numbers inside a model. Training is the process of setting them. Model size is usually quoted as a count of these.
- probe
- A small separate model trained to read information out of a bigger model's internals, used as a measuring instrument rather than as a product.
- rank
- How many independent directions a set of numbers really uses. A low-rank structure is one that looks high-dimensional but is actually simple underneath.
- recurrent
- A design that reads a sequence one item at a time, carrying memory forward. The main alternative is attention, which looks at everything at once.
- seed
- The number that fixes all the randomness in a training run. Same seed, same run. Running several seeds is how you tell a real effect from a lucky one.
- SGD
- Stochastic Gradient Descent. The simplest training algorithm: take a step in the direction the gradient points, every time, with no adaptation.
- singular value
- A measure of how much a mathematical operation stretches things along one particular direction. The largest one describes the direction of strongest effect.
- slope
- How steeply one quantity changes as another does. A slope of one between a warning and the event it predicts means the warning shifts exactly in step with the event.
- stable rank
- A way of counting how many directions a set of numbers meaningfully uses that does not depend on the overall scale.
- variance
- How spread out a set of numbers is. Rising variance in a signal means it is becoming more erratic.
- width
- How many internal numbers a model uses at each layer. The usual way we vary model size in these experiments.
Get new results as we publish them
Roughly monthly, one finding per email, in plain English first. Including the approaches that turned out not to work, which are usually the useful ones. No sales email.
Double opt-in: we send a confirmation link and add nobody who does not click it. One-click unsubscribe on every email.