
The Loss Signal and the Formula
Ongoing research. This is an experimental result from active work, not a settled conclusion. The numbers are what we measured and the method is described so you can judge it, but the programme is still running and later experiments may revise what it means.
A note on the language in these records. This is a working laboratory notebook for research into training AI models more cheaply and efficiently, so you will read that an approach did not work, that a result did not hold up, or that one method was worse than another. That is the research doing its job, not a verdict on the engineering we deliver to clients. Ruling an approach out is how the search narrows, and these are the pages that teach us the most: nearly every technique we now rely on came from understanding why something else fell short. Testing our own ideas at least as hard as anyone else's is the point of publishing them. More about this programme and why we run it.
Part of a bigger question: What actually makes training cheaper? – One thing has worked: stopping part of the training early saved about 7% with no loss of quality. Everything else tested has been matched by a simpler or cheaper method -- and in two cases the clever method was only winning because it was quietly being given more.
In plain English
What we asked. We have two free ways to predict when a small model will suddenly get good at its task. One is a formula based only on the model's size and the task's difficulty. The other is to watch the model's loss, a number training computes anyway, which starts falling a little before accuracy jumps. Nobody had compared them.
What we found. Overall the formula won: it was off by about 10 steps, the loss signal by about 16. But for tasks sharing the same vocabulary, the loss signal was better, off by under 5 steps. It failed when the vocabulary changed, because the loss starts from a different height, so the same warning arrives at a very different moment.
Why it matters. The fix to try next is measuring the loss against a level set by the vocabulary itself.
The rest of this page is the technical record: the design, every number, and the limits. It is written for a reviewer, and you do not need it to have understood the result above.
New here? How to read a research record
- Start at the verdict. Every record states, before the experiment was run, what result would have made us abandon the idea. That is the "kill test". Then it says whether the test fired. Nothing gets reinterpreted after the fact.
- Numbers in square brackets are uncertainty.
23.4 [18.1, 28.7]means our best estimate is 23.4 and the true value is probably somewhere in that range. If a range includes zero, we cannot claim an effect. - Results that rule an idea out are kept. Roughly half of what is published here says an approach did not work, including plenty of our own. Those pages are the output, not a shortfall: knowing which direction is a dead end is what lets the next experiment go somewhere better, and most of what we now rely on came out of understanding why something else fell short. Work that only publishes what worked is not measuring anything.
- Read the Limits section. Every record ends with what it does not show. It is the most honest part of any experiment and usually the shortest.
- Pro tip: the figures near the top are designed to carry the result on their own. If you read nothing else, read the caption under each one, which says what it shows and what to take from it.
EXPLORATORY. Not a preregistered study. Local CPU, 85 training runs of2,500steps re-running N6's settled cells. The design and kill test were committed (1c55a2e) before any run.
Program v2 Bucket N, item N20. Decisive computation: analysis/loss_versus_schedule.pyanalysis/loss_versus_schedule.jsonpython analysis/loss_versus_schedule.py (about three hours on a throttled laptop CPU); --reuse re-derives every endpoint from the saved curves, and was checked to print the identical summary.
The question
N14 found a free offline formula (width, lag and vocabulary, fitted on runs already done) predicts a held-out cell's accuracy crossing to within 9.6 steps on average, across N6's 17 settled cells. M6 had found a second free instrument that reads the run in front of you: held-out loss reaches its own midpoint before held-out accuracy does, in every seed. The two were never compared.
Design. N6's 17 settled cells, five seeds each, re-run through N6's own train() with a forward hook that records held-out cross-entropy at every evaluation and changes nothing else. The event is N14's (the absolute 0.5 accuracy crossing, interpolated); the loss instrument is M6's (the step held-out loss falls through the midpoint of its own start and end); its calibration -- the lead from loss crossing to accuracy crossing -- is fitted on the other 16 cells and added to each held-out cell's runs; the score is N14's mean absolute cell error.
Kill test, fixed before execution: the loss crossing's leave-one-cell-out error exceeds 9.6 steps.
Anchor, in code: every one of the 85 re-runs' accuracy curves equals N6's committed curve exactly, and the accuracy the hook computes equals the one N6's loop records. All do.
Result: the kill test fires
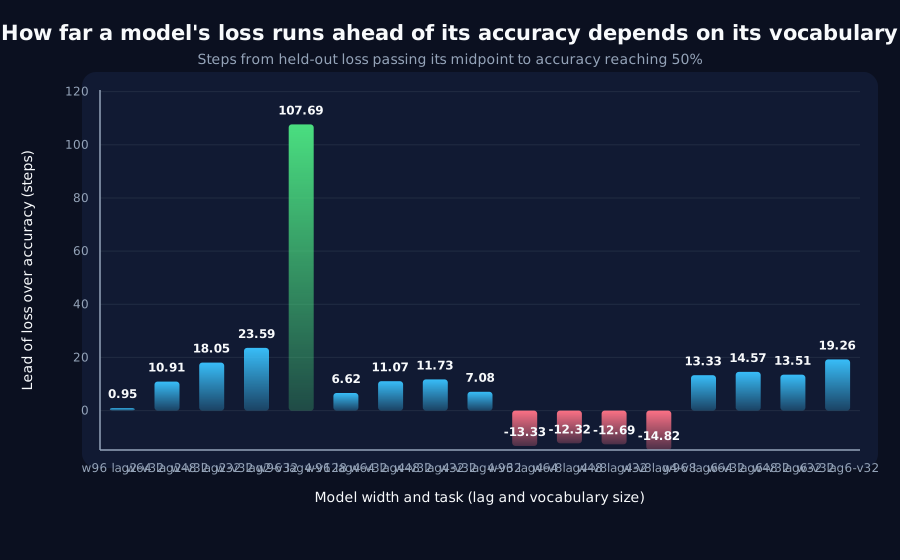
Mean cell error 15.69 [3.15, 28.22] steps, against the formula's 9.6. The median cell error is 6.35 steps; the mean is carried by two vocabulary columns:
| Cell | Observed crossing | Predicted | The cell's own lead (accuracy minus loss) |
|---|---|---|---|
w48 lag2-v32 | 53.0 | 46.7 | +18.1 |
w48 lag4-v32 | 84.7 | 85.1 | +11.7 |
w48 lag6-v32 | 119.5 | 118.0 | +13.5 |
w96 lag4-v128 | 191.7 | 90.1 | +107.7 |
w48 lag4-v8 | 24.3 | 50.6 | -12.7 |
(the width-48 row of each difficulty, and the only settled lag4-v128 cell; every cell is in the output)
- With vocabulary fixed at
32, across three lags and four widths, the loss crossing plus one shared lead predicts the accuracy crossing to4.8steps on average -- better than the formula. This is post hoc and not the test. - When vocabulary changes, the lead breaks. At vocabulary
128held-out loss passes its midpoint108steps before accuracy crosses0.5; at vocabulary8it passes it13steps after. A loss curve starts at the log of the vocabulary size, so its own midpoint sits at a very different point in learning when the vocabulary changes, and one calibrated lead cannot serve both.
What stands
- Kill test fires. The loss crossing localises the accuracy crossing to
15.7steps, worse than the free formula's9.6; the formula remains the best free instrument on this grid. - On a fixed vocabulary it is the better one (
4.8steps across twelve cells), post hoc. - Like the probe (N17, N24), the loss signal's lead is a property of the task, here of its vocabulary.
- Generates N25: a vocabulary-normalised loss crossing (loss measured relative to the log of the vocabulary), fixed in advance, scored the same way.
Limits
- N6's grid only: width
32-96, lags2-6, vocabularies8-128, one learning rate. - One loss definition (M6's midpoint); other crossings of the loss curve were not tried.
Terms on this page
Every piece of vocabulary this record uses, in plain language. Generated from the text above, so it cannot drift out of step with it.
- accuracy
- The fraction of answers a model gets right on questions it was not trained on.
- calibrated
- A model is calibrated when its confidence matches how often it is right: answers it gives with 90% confidence should be right about 90% of the time.
- calibration
- Working out an instrument's settings from runs whose answer you already know, so it can be used on a run whose answer you do not.
- cross-entropy
- The standard score a language model is trained to reduce. Lower means the model assigned more probability to what actually came next.
- held-out
- Data the model was never trained on, kept back specifically to test it. Scoring a model on data it has already seen measures memorisation, not learning.
- kill test
- A condition written down before running the experiment that says what result would make us abandon the idea. Fixing it in advance is what stops a disappointing result being reinterpreted as an encouraging one.
- learning rate
- How big a step training takes each time it updates the model. Too small and nothing happens; too big and it never settles.
- post hoc
- Worked out after the fact, rather than decided in advance. We report such checks separately and never let them decide a result, because it is far too easy to find a pattern once you already know the answer.
- probe
- A small separate model trained to read information out of a bigger model's internals, used as a measuring instrument rather than as a product.
- seed
- The number that fixes all the randomness in a training run. Same seed, same run. Running several seeds is how you tell a real effect from a lucky one.
- settled
- A run has settled when it has stopped improving. Measurements anchored to a run's own best score are unreliable until it has, because that best score is still moving.
- vocabulary
- The set of distinct symbols a model can read and produce.
- width
- How many internal numbers a model uses at each layer. The usual way we vary model size in these experiments.
Get new results as we publish them
Roughly monthly, one finding per email, in plain English first. Including the approaches that turned out not to work, which are usually the useful ones. No sales email.
Double opt-in: we send a confirmation link and add nobody who does not click it. One-click unsubscribe on every email.