
The Early Warning We Already Had
Ongoing research. This is an experimental result from active work, not a settled conclusion. The numbers are what we measured and the method is described so you can judge it, but the programme is still running and later experiments may revise what it means.
A note on the language in these records. This is a working laboratory notebook for research into training AI models more cheaply and efficiently, so you will read that an approach did not work, that a result did not hold up, or that one method was worse than another. That is the research doing its job, not a verdict on the engineering we deliver to clients. Ruling an approach out is how the search narrows, and these are the pages that teach us the most: nearly every technique we now rely on came from understanding why something else fell short. Testing our own ideas at least as hard as anyone else's is the point of publishing them. More about this programme and why we run it.
Part of a bigger question: Can you tell in advance that a model is about to improve? – Yes, repeatedly and by several independent routes -- a probe on the hidden state, gradient statistics, held-out loss, and which earlier word the prediction leans on. The warnings are real; how far ahead they fire varies a great deal.
In plain English
What we asked. The models we study do not improve gradually. They sit still for a long time and then, over a handful of steps, get good. Everything this project has said about that moment rests on a score that marks each prediction right or wrong, and that kind of score can manufacture a sudden jump out of a gradual change: if the right answer is slowly gaining on its nearest rival, nothing visible happens until it finally overtakes, and then everything appears to happen at once. So the jump we have been studying might have been an artifact of how we were keeping score. Nobody here had checked, across fifty-four published results.
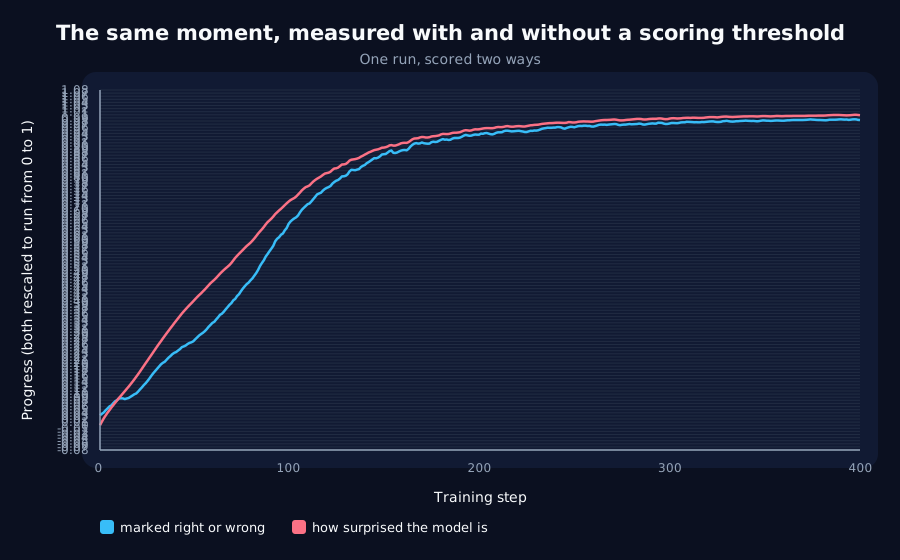
What we found. We measured the same runs a second way, using how surprised the model is by the correct answer, which has no right-or-wrong line in it anywhere. The jump is still there and almost exactly as sharp: the second measure keeps 93% of the sharpness of the first. So the sudden improvement is a real change in what the model predicts, not a trick of our scoring. The scoring does exaggerate it, but only by about 8%, which is worth saying precisely rather than either ignoring or overstating.
Why it matters. The more useful thing turned up by accident. The surprise measure reaches its halfway point about 19 steps before the right-or-wrong score does, in every single run. That is an early warning that a model is about to improve, and it costs nothing at all, because it is a number almost every training run already calculates. Earlier in this project we built a special-purpose instrument to buy a warning of about the same length, and it consumed more than half the training budget. The free version was there the whole time and we had walked past it fifty-four times. The lesson we have written down for ourselves: before building an instrument, look at what you are already measuring.
The rest of this page is the technical record: the design, every number, and the limits. It is written for a reviewer, and you do not need it to have understood the result above.
New here? How to read a research record
- Start at the verdict. Every record states, before the experiment was run, what result would have made us abandon the idea. That is the "kill test". Then it says whether the test fired. Nothing gets reinterpreted after the fact.
- Numbers in square brackets are uncertainty.
23.4 [18.1, 28.7]means our best estimate is 23.4 and the true value is probably somewhere in that range. If a range includes zero, we cannot claim an effect. - Results that rule an idea out are kept. Roughly half of what is published here says an approach did not work, including plenty of our own. Those pages are the output, not a shortfall: knowing which direction is a dead end is what lets the next experiment go somewhere better, and most of what we now rely on came out of understanding why something else fell short. Work that only publishes what worked is not measuring anything.
- Read the Limits section. Every record ends with what it does not show. It is the most honest part of any experiment and usually the shortest.
- Pro tip: the figures near the top are designed to carry the result on their own. If you read nothing else, read the caption under each one, which says what it shows and what to take from it.
EXPLORATORY. Not a preregistered study. Local CPU, 8 training runs, no GPU, no cost.
Program v2 Bucket M, item M6. Decisive computation: analysis/compression_view.pyanalysis/compression_view.jsonpython analysis/compression_view.py, or re-derive every endpoint with --reuse.
The question
Every transition in this programme is measured on held-out accuracy, which is a thresholded quantity. An argmax scores a prediction right or wrong, and it turns a smooth change in the underlying distribution into a step the moment the correct token overtakes its rival. So a sharp jump in accuracy is consistent with two different things, and fifty-four records had never distinguished them: either the predictive distribution changes abruptly, or it changes smoothly and the argmax makes a cliff out of it.
PPM (Cleary and Witten, 1984) supplies the unthresholded view, prediction and compression are the same problem, so the same model in bits per token is the loss with no argmax in the way.
Kill test, fixed in advance: the bits-per-token curve is smooth where the accuracy curve jumps.
Result: the transition is real
Eight seeds, sharpness measured as the largest change over any 5-step window as a share of the total change, rescaled so 1.0 is a straight line.
| Midpoint step | Sharpness (× a straight line) | |
|---|---|---|
| accuracy | 83.5 [81.3, 85.7] | 4.50 [4.28, 4.72] |
| bits per token | 64.5 [63.0, 66.0] | 4.16 [4.02, 4.31] |
The kill test does not fire. The bits curve keeps 93% of the accuracy curve's sharpness. The jump is a change in the model's predictive distribution, not an artifact of thresholding a smooth one.
Thresholding does contribute, and it is small. The paired difference is +0.336 [+0.082, +0.591], which excludes zero: the argmax genuinely sharpens the curve, by about 8%. That is worth stating precisely because a significance test alone would have supported the opposite headline. The magnitude decides; the significance is reported.
Bits per token runs 5.157 at the start, just above the 5.000 of chance on a 32-token vocabulary, as it should be, to 0.094 at the end.
The unplanned finding, which matters more
The bits curve reaches its midpoint 19 steps [-20.6, -17.4] before the accuracy curve.
Held-out loss leads held-out accuracy, consistently, in every seed. That is a leading indicator with no probe, no gradient buffer and no eigendecomposition: it is a number most training loops already compute.
Put beside what this programme has spent on the same quantity:
| Instrument | Lead | Cost per step |
|---|---|---|
| F2's decode probe | +23.5 steps | 55.4% (J7) |
K1's off_top | +30.4 | 9.0% |
K1's global_norm | +30.8 | 0.15% |
| held-out bits per token | +19.0 | already computed |
The lead is shorter. It is also free, and it required no instrument to be built. Nobody looked, across fifty-four records that included two items specifically about buying a lead cheaply.
This does not rescue the timing story. K1 showed the manoeuvre a lead is spent on works just as well timed at random, and K2 showed the one real saving needs no detector at all. A cheaper detector does not change either. But if a lead is ever wanted, this is the one to start from.
Verdict
- The kill test does not fire. The transition is in the distribution, not in the threshold, and the programme's central phenomenon survives the check it had never had.
- Thresholding sharpens the curve by
8%, measurably but not materially. - Held-out loss leads held-out accuracy by
19steps, for free, a fact available since the first record. - The accuracy midpoint reproduces the published transition at this configuration, which is what licenses the rest.
Limits
- Eight seeds, one task, one width, one learning rate, one window length. The sharpness window was not swept; the rescaling makes the number comparable across windows, but the ranking of two curves at one window is not proof of a ranking at all windows.
- Sharpness is one shape statistic. A curve can be steep and smooth or steep and jagged, and this does not distinguish those.
- The
19-step lead is measured on the same held-out batch used for accuracy. It is a genuine lead in the sense that matters, the loss moves first, but both come from the same evaluation, so this is not an independent instrument in the way a probe on the hidden state is. - Bits per token requires a held-out evaluation, which is not free in the way a gradient norm is. "Already computed" is true of any loop that already evaluates, and false of one that does not.
- Nothing here says the transition is sharp in an absolute sense.
4.5xa straight line is the measured value; whether that counts as a phase transition is a question about definitions that this record does not settle.
Terms on this page
Every piece of vocabulary this record uses, in plain language. Generated from the text above, so it cannot drift out of step with it.
- accuracy
- The fraction of answers a model gets right on questions it was not trained on.
- argmax
- Short for 'the argument that maximises'. A model outputs a score for every possible next token; the argmax is simply whichever one scored highest. Accuracy is measured on the argmax, which is why accuracy is a thresholded quantity: only the winner counts, and by how much it won is discarded.
- bits per token
- How surprised the model is by the correct answer, in the units used by compression. It is the training loss written a different way. Unlike accuracy it has no right-or-wrong threshold in it, so a gradual change in the model shows up as a gradual change in the number. Pure guessing on a 32-symbol vocabulary costs 5 bits per token.
- gradient
- The direction and amount by which each of a model's internal numbers should change to do slightly better. Training is repeatedly following it.
- held-out
- Data the model was never trained on, kept back specifically to test it. Scoring a model on data it has already seen measures memorisation, not learning.
- hidden state
- The model's working memory: the internal numbers it carries from one step of a sequence to the next.
- kill test
- A condition written down before running the experiment that says what result would make us abandon the idea. Fixing it in advance is what stops a disappointing result being reinterpreted as an encouraging one.
- learning rate
- How big a step training takes each time it updates the model. Too small and nothing happens; too big and it never settles.
- phase transition
- A point in training where a model's performance jumps abruptly from bad to good, rather than improving gradually. Most of this programme is about what happens at that moment.
- probe
- A small separate model trained to read information out of a bigger model's internals, used as a measuring instrument rather than as a product.
- seed
- The number that fixes all the randomness in a training run. Same seed, same run. Running several seeds is how you tell a real effect from a lucky one.
- sharpness
- How abrupt a model's improvement is. We measure the biggest change over any short stretch of training as a share of the run's total change, scaled so that a model improving at a perfectly steady rate would score 1. A score of 20 means the fastest stretch was twenty times steeper than a straight line.
- vocabulary
- The set of distinct symbols a model can read and produce.
- width
- How many internal numbers a model uses at each layer. The usual way we vary model size in these experiments.
Get new results as we publish them
Roughly monthly, one finding per email, in plain English first. Including the approaches that turned out not to work, which are usually the useful ones. No sales email.
Double opt-in: we send a confirmation link and add nobody who does not click it. One-click unsubscribe on every email.