
The Jump Needs Room To Spare
Ongoing research. This is an experimental result from active work, not a settled conclusion. The numbers are what we measured and the method is described so you can judge it, but the programme is still running and later experiments may revise what it means.
A note on the language in these records. This is a working laboratory notebook for research into training AI models more cheaply and efficiently, so you will read that an approach did not work, that a result did not hold up, or that one method was worse than another. That is the research doing its job, not a verdict on the engineering we deliver to clients. Ruling an approach out is how the search narrows, and these are the pages that teach us the most: nearly every technique we now rely on came from understanding why something else fell short. Testing our own ideas at least as hard as anyone else's is the point of publishing them. More about this programme and why we run it.
Part of a bigger question: How much model does a task need, and what changes when it has more? – The abrupt jump is what spare capacity buys -- it fades smoothly as the model shrinks, long before the model stops working. Capacity and task difficulty act separately, not as a ratio.
In plain English
What we asked. The models we study do not improve gradually. They answer no better than guessing for a while and then get good over a short stretch, and most of this project is about that stretch. An obvious question we had never asked is whether the abruptness is a property of the exercise or a property of the model. Every experiment so far had either kept the model the same size or made it bigger.
What we found. So we made it smaller, ten sizes down, changing nothing else. The improvement gets steadily less abrupt as the model shrinks: at the largest size it is about twenty-three times as steep as a straight line, and at roughly a quarter of that size it is about thirteen times, while the model is still solving the task almost perfectly. Below about 650 internal values the models stop learning the task altogether, and that cut-off is abrupt in its own right: one size smaller and none of the five runs succeed.
Why it matters. The reading we take from this is that the sudden jump is what a model does when it has more capacity than the job needs. It is not the model straining against its limits. That fits with a separate result of ours, where a rule with no parameters solves the same task outright: the task asks for very little and the model brings a great deal. One caution worth repeating, because it nearly caught us: our measure of abruptness compares the steepest stretch to the whole change, so a model that has not finished improving looks smooth for reasons that have nothing to do with the question. Smaller models finish later, so that error would have pushed exactly the way we expected the answer to go. We ran everything for three times as long and set aside the sizes that still had not settled.
The rest of this page is the technical record: the design, every number, and the limits. It is written for a reviewer, and you do not need it to have understood the result above.
New here? How to read a research record
- Start at the verdict. Every record states, before the experiment was run, what result would have made us abandon the idea. That is the "kill test". Then it says whether the test fired. Nothing gets reinterpreted after the fact.
- Numbers in square brackets are uncertainty.
23.4 [18.1, 28.7]means our best estimate is 23.4 and the true value is probably somewhere in that range. If a range includes zero, we cannot claim an effect. - Results that rule an idea out are kept. Roughly half of what is published here says an approach did not work, including plenty of our own. Those pages are the output, not a shortfall: knowing which direction is a dead end is what lets the next experiment go somewhere better, and most of what we now rely on came out of understanding why something else fell short. Work that only publishes what worked is not measuring anything.
- Read the Limits section. Every record ends with what it does not show. It is the most honest part of any experiment and usually the shortest.
- Pro tip: the figures near the top are designed to carry the result on their own. If you read nothing else, read the caption under each one, which says what it shows and what to take from it.
EXPLORATORY. Not a preregistered study. Local CPU, 50 training runs, no GPU, no cost.
Program v2 Bucket M, item M5. Decisive computation: analysis/width_floor.pyanalysis/width_floor.jsonpython analysis/width_floor.py, or re-derive every endpoint with --reuse.
The question
K3 and L1 push upward on width. Nobody had pushed down. There is a width at which the model cannot represent the solution at all, and the interesting question is what happens just above it: does the sudden jump survive to the point of total failure, or is there a band where the model still learns the task but learns it gradually?
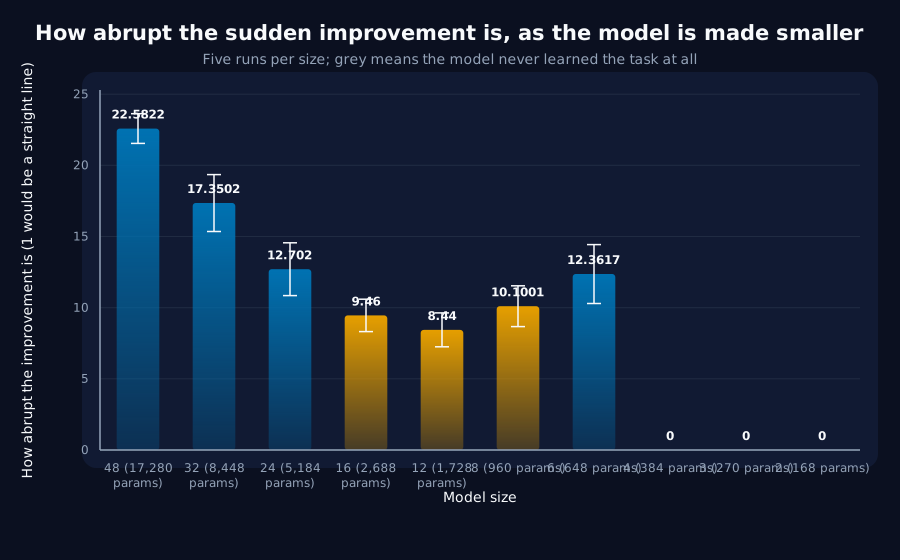
The answer locates the phenomenon. A jump that persists until the model simply cannot do the task says the transition is about search, finding a solution that was always representable. Gradual learning near the failure point says it is about capacity, and that the jump is what a model does when it has room to spare.
Kill test, fixed in advance: the transition persists at every width down to the point of total failure, with no floor distinguishable from "the model can no longer do the task at all".
Result: sharpness falls with width, monotonically, and the floor is sharp
Ten widths, five seeds each, 2,500 steps, everything else unchanged. Measured chance is 0.0346.
| width | parameters | learned | final accuracy | sharpness | transition step | |
|---|---|---|---|---|---|---|
| 48 | 17,280 | 5/5 | 0.9957 [0.9938, 0.9975] | 22.58 [21.54, 23.63] | 91 [88, 94] | anchor |
| 32 | 8,448 | 5/5 | 0.9910 [0.9863, 0.9958] | 17.35 [15.35, 19.35] | 111 [103, 119] | |
| 24 | 5,184 | 5/5 | 0.9586 [0.9502, 0.9670] | 12.70 [10.85, 14.56] | 138 [131, 145] | |
| 16 | 2,688 | 5/5 | 0.8011 [0.7152, 0.8870] | 9.46 [8.32, 10.60] | 191 [166, 216] | still climbing |
| 12 | 1,728 | 5/5 | 0.6732 [0.6132, 0.7332] | 8.44 [7.25, 9.63] | 237 [188, 286] | still climbing |
| 8 | 960 | 5/5 | 0.4028 [0.3324, 0.4731] | 10.10 [8.67, 11.53] | 217 [184, 250] | still climbing |
| 6 | 648 | 5/5 | 0.2863 [0.2562, 0.3163] | 12.36 [10.29, 14.43] | 214 [190, 238] | |
| 4 | 384 | 0/5 | 0.1902 [0.1809, 0.1996] | , | , | |
| 3 | 270 | 0/5 | 0.1048 [0.0607, 0.1489] | , | , | |
| 2 | 168 | 0/5 | 0.0575 [0.0522, 0.0627] | , | , |
The kill test does not fire. Sharpness at width 32, 24 and 6 sits entirely below width 48's interval. Across the three settled rows above the failure point it falls monotonically with width: 22.58 → 17.35 → 12.70.
A model that never moves is not a model that learned smoothly, so any width whose accuracy fails to clear 0.20 above its own chance level is reported as failed rather than as gradual. That distinction is made in code, not in prose, because without it the three dead rows would have entered the table as the smoothest transitions of all.
The floor is at width 4. At width 6 (648 parameters) all five seeds still learn and still transition; at width 4 (384 parameters) none of them do, though 0.1902 is well above chance, so the failure is partial capability rather than nothing at all.
The confound this had to survive
Sharpness is the largest change as a share of the run's total change, so a curve still climbing when the run ends has a denominator that is not final and reads as gradual whether or not it is. Narrow models learn more slowly, so the confound runs in exactly the direction of the expected result.
The first execution used 800 steps, and every width below 32 was still climbing, which would have produced this record's headline for a reason that has nothing to do with the phenomenon. At 2,500 steps three rows still have not settled (16, 12, 8) and are excluded from the verdict; the conclusion rests on 32, 24 and 6, which have.
What this says about the phenomenon
The sharp jump is not an intrinsic property of the task. It is what happens when the model has capacity to spare relative to the task: at 17,280 parameters the curve is 22.6× as steep as a straight line, and at 5,184 parameters, still solving the task to 0.96: it is 12.7×.
Read alongside M1, which showed a zero-parameter cache model solves this task outright, a consistent picture: the task needs almost nothing, the network has far more than it needs, and the sharpness of the transition is a function of that excess. Whatever the jump is, it is not the model straining against the limits of what it can represent.
Verdict
- The kill test does not fire. A gradual band exists among settled rows, and sharpness declines monotonically with width above the failure point.
- The floor is between width 6 and width 4, 648 and 384 parameters. Below it no seed learns.
- The anchor reproduced: width 48 transitions at step
91[88, 94]. - Three rows are excluded as unsettled, and saying so is the difference between this result and the one the first execution would have reported.
Limits
- Sharpness here is not comparable to M6's. The rescaling divides by the straight-line expectation for this run length, so a 2,500-step run at 500 samples gives larger numbers than a 400-step run at 400 samples. Comparisons within this table are valid; comparisons to another record's sharpness are not.
- Widths 16, 12 and 8 are unsettled at 2,500 steps and decide nothing here. A longer run would fill in the middle of the curve, and the monotone trend predicts what it would show.
- Five seeds per width, one task, one learning rate, one optimizer. Learning rate was not retuned per width, and a narrow model might prefer a different one, which is a real alternative explanation for slower, smoother learning at small widths.
- "Learned" is a threshold at
0.20above measured chance. Width 4 reaches0.19, so it sits just under a line drawn by us; a different line would move the floor by one row. - One architecture. K5 found the critical period is a gating fact rather than a GRU fact, so the floor's location is probably architecture-specific even if the trend is not.
Terms on this page
Every piece of vocabulary this record uses, in plain language. Generated from the text above, so it cannot drift out of step with it.
- accuracy
- The fraction of answers a model gets right on questions it was not trained on.
- architecture
- The blueprint of a model: what components it has and how they connect. Two models can be the same size and completely different architectures.
- confound
- A second explanation you did not control for. If bigger models both learn faster and score higher, then 'fast learners score higher' may be entirely about size and not about speed.
- critical period
- A stretch of time during which something has to happen for development to proceed normally. Borrowed from biology, where it describes windows in which a young brain must receive certain input.
- GRU
- Gated Recurrent Unit. A compact design for processing sequences one item at a time, with internal switches controlling what it keeps in memory.
- kill test
- A condition written down before running the experiment that says what result would make us abandon the idea. Fixing it in advance is what stops a disappointing result being reinterpreted as an encouraging one.
- learning rate
- How big a step training takes each time it updates the model. Too small and nothing happens; too big and it never settles.
- optimizer
- The algorithm that decides how to change the model given the gradient. AdamW and SGD are two common choices and they behave differently.
- parameters
- The adjustable numbers inside a model. Training is the process of setting them. Model size is usually quoted as a count of these.
- seed
- The number that fixes all the randomness in a training run. Same seed, same run. Running several seeds is how you tell a real effect from a lucky one.
- settled
- A run has settled when it has stopped improving. Measurements anchored to a run's own best score are unreliable until it has, because that best score is still moving.
- sharpness
- How abrupt a model's improvement is. We measure the biggest change over any short stretch of training as a share of the run's total change, scaled so that a model improving at a perfectly steady rate would score 1. A score of 20 means the fastest stretch was twenty times steeper than a straight line.
- width
- How many internal numbers a model uses at each layer. The usual way we vary model size in these experiments.
Get new results as we publish them
Roughly monthly, one finding per email, in plain English first. Including the approaches that turned out not to work, which are usually the useful ones. No sales email.
Double opt-in: we send a confirmation link and add nobody who does not click it. One-click unsubscribe on every email.